Skip to content
New issue

Have a question about this project? Sign up for a free GitHub account to open an issue and contact its maintainers and the community.

By clicking “Sign up for GitHub”, you agree to our terms of service and privacy statement. We’ll occasionally send you account related emails.

Already on GitHub? Sign in to your account

viz oceano bottle data (temp, o2, oa, dic) #2

Open
4 of 6 tasks
bbest opened this issue Jan 25, 2022 · 5 comments
Open
4 of 6 tasks

viz oceano bottle data (temp, o2, oa, dic) #2

bbest opened this issue Jan 25, 2022 · 5 comments
Assignees

Comments

@bbest
Copy link
Contributor

bbest commented Jan 25, 2022

  • read the data
  • map by station id. for now use the lon/lat in the file; maybe later lookup an authoritative location.
  • extract points by area of interest (aoi)
  • interpolate points to surface with idw() or krige() and extract from surface
  • create read_bottle() in calcofi4r
  • visualize initial variables

Background

Appendix 1: CalCOFI Data Inventory 2021 - Google Sheets:
- Ocean temperature & HCI: temperature, salinity, oxygen, nutrients
- Hypoxia: temperature, salinity, oxygen, nutrients
- [OA/DIC: separate db; on website under pH]: Dissolved inorganic carbon (DIC) & total alkalinity (TA)

@bbest
Copy link
Contributor Author

bbest commented Jan 25, 2022

Profiling

@bbest
Copy link
Contributor Author

bbest commented Jan 25, 2022

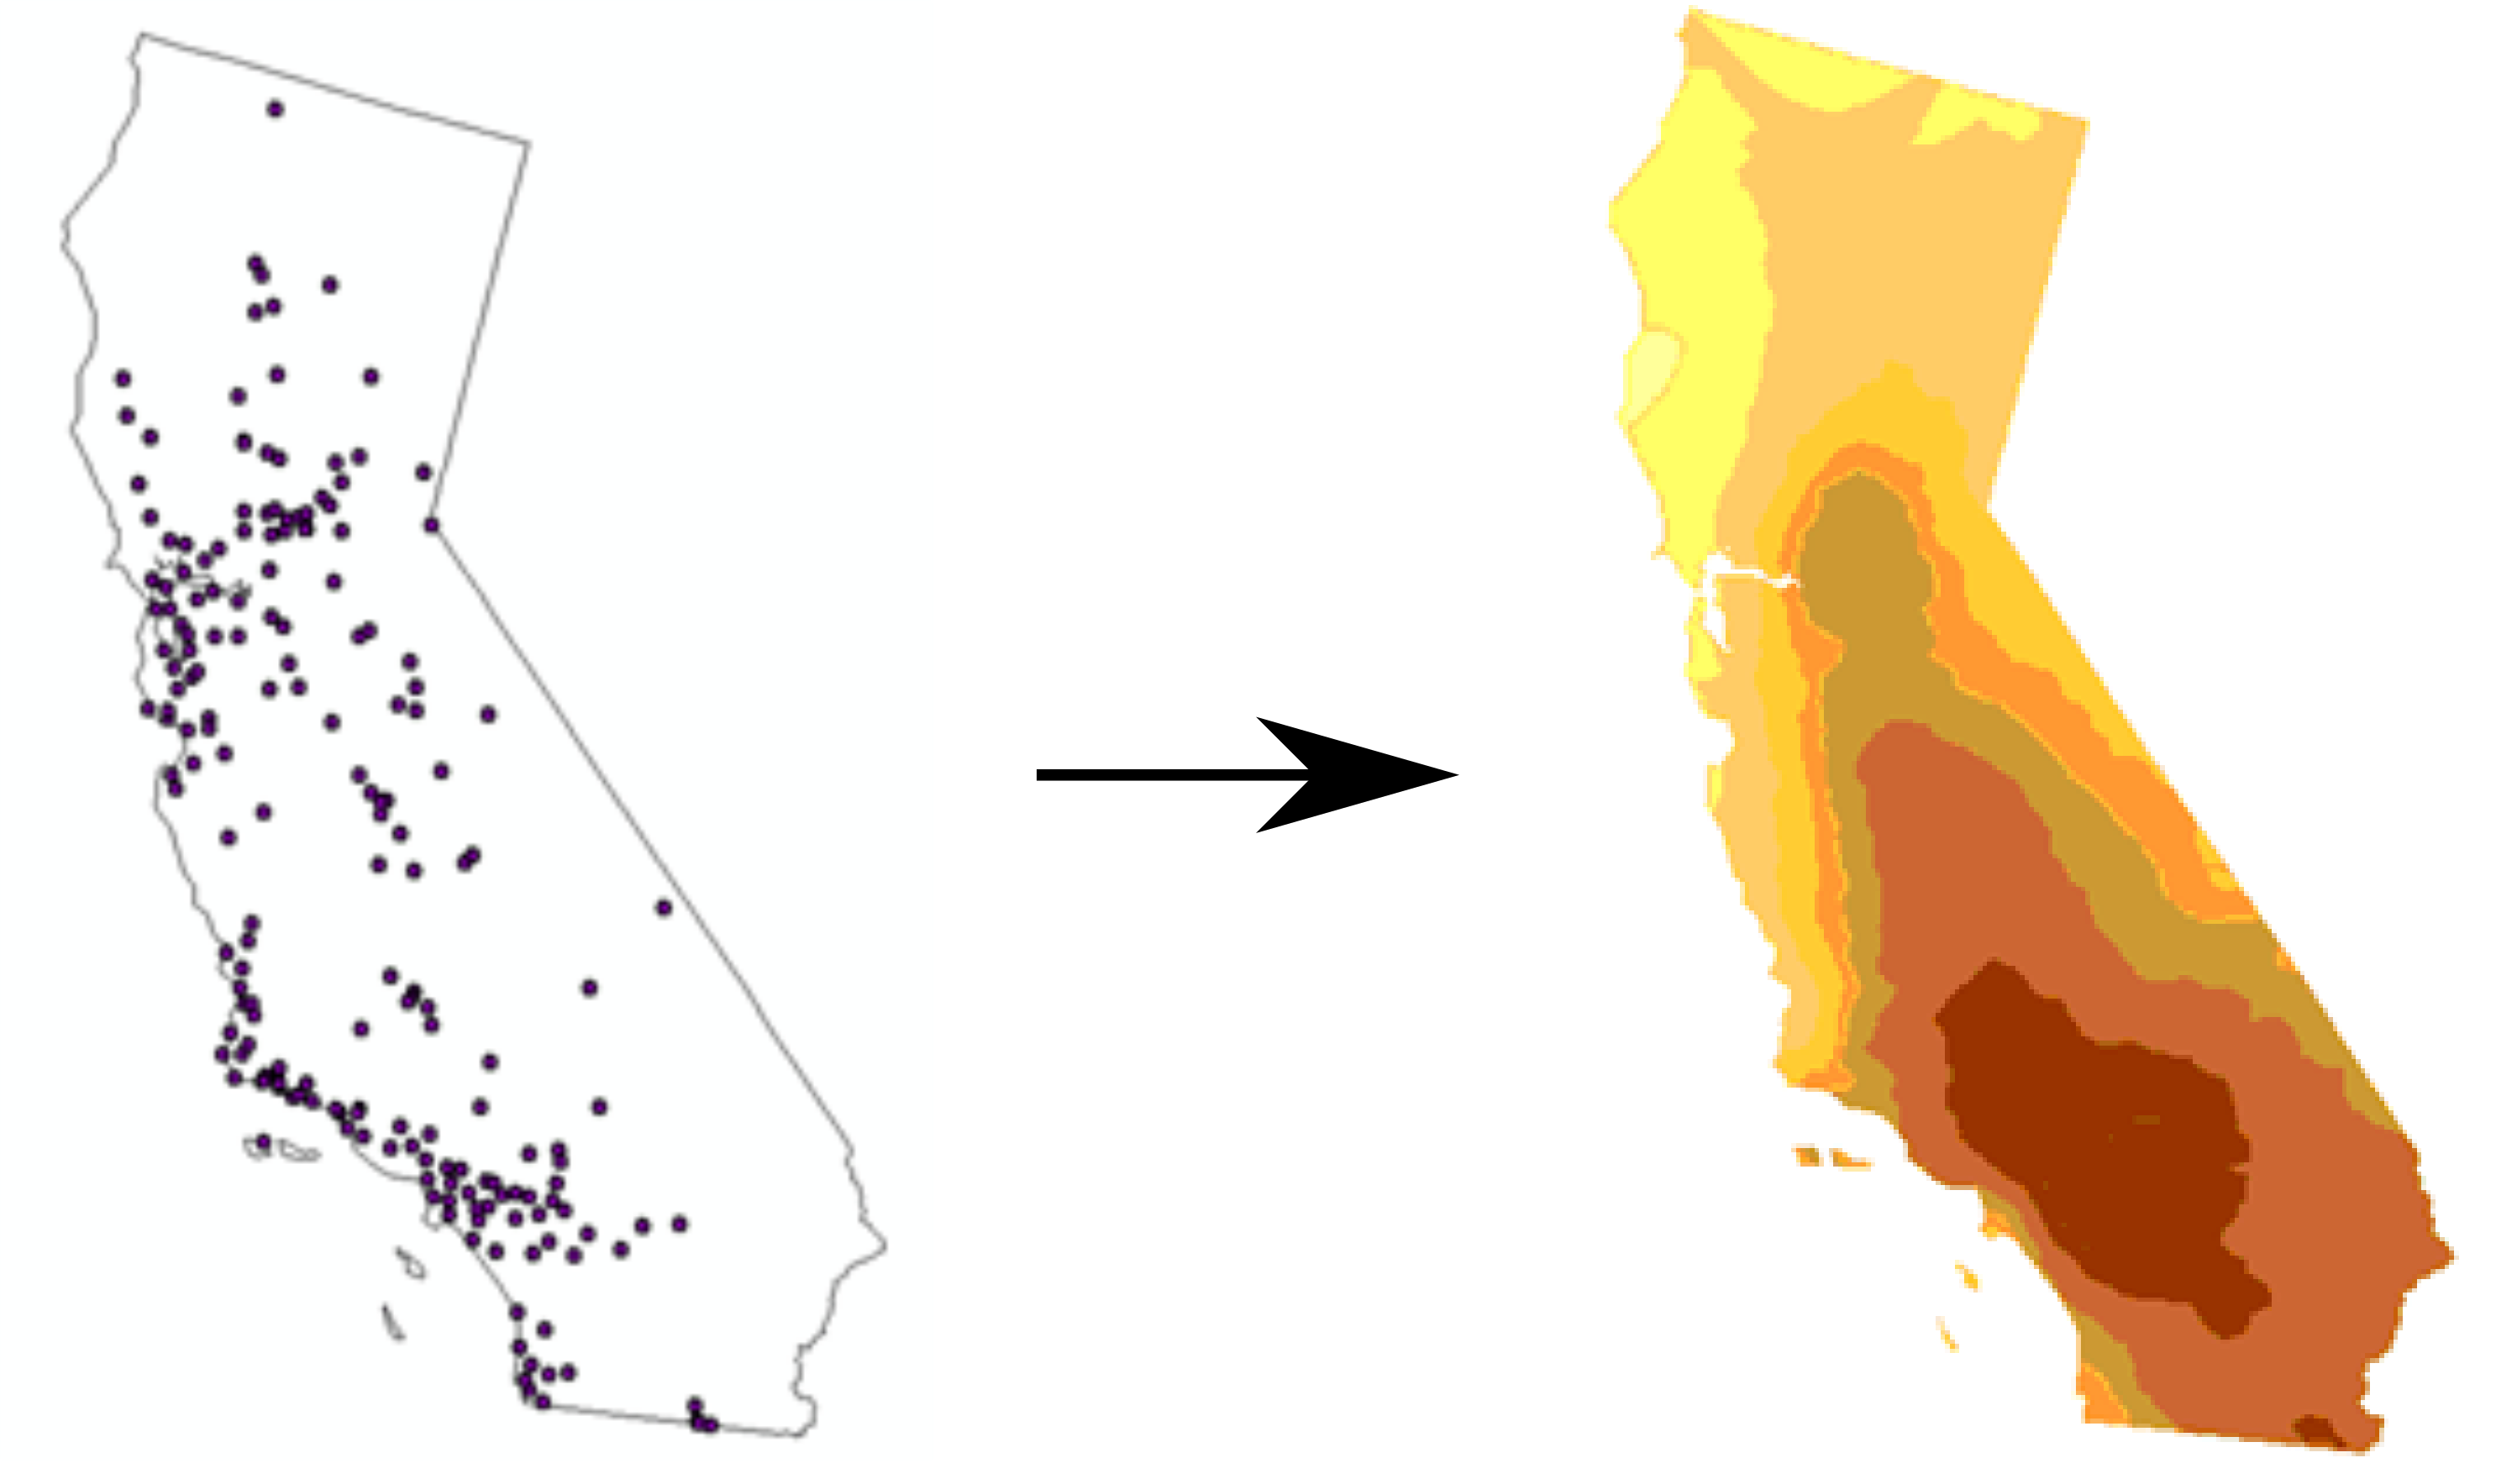
I. Detailed Views for Scientific Audience

A. Survey Tracks

  • Initial Map View: survey tracks
  • Selectable: segments along each line (that could include underway data along surface)
  • Plot: Profile plot along track, so starting distance (min(date)) on x axis

B. Interpolated Surface

  • Initial Map View: kriged surface, possibly with light tracks overlaid
  • Selectable: draw a transect (within extent of kriged surface)
  • Plot:
    • Profile plot along arbitrary transect
    • Measures of uncertainty with plot

II. Synoptic Views for General Audience

A. Survey Tracks

  • Initial Map View: survey tracks
  • Selectable:
    • Management polygon
  • Plot: Profile plot along track, so starting distance (min(date)) on x axis

B. Interpolated Surface

  • Initial Map View: kriged surface, possibly with light tracks overlaid
  • Selectable: draw a transect (within extent of kriged surface)
  • Plot:
    • Profile plot along arbitrary transect
    • Measures of uncertainty with plot

bbest added a commit that referenced this issue Jan 25, 2022
@bbest
Copy link
Contributor Author

bbest commented Jan 25, 2022

See knitted Rmarkdown html with first read of data here:

https://calcofi.github.io/scripts/oceano-bottle.html

Let's consider the following example of CalCOFI survey tracks and wanting to extract information for an Area of Interest (AOI) for some management purpose:

https://shiny.ecoquants.com/calcofi/
Screen Shot 2022-02-09 at 1 32 05 PM

Summarize by AOI

1. Summary stats on station data as points

Function to generate basic statistics (avg, min, max, stdev, hi90, lo10) given some parameters:

  • aoi: area of interest, as well known text (sf::st_text()) for eventually using in an API function mode
  • date_beg: filter by start date
  • date_end: filter by end date
  • date_step: some notion of summarizing by annual / seasonal / quarterly
  • depth_min: filter by depth from surface (which direction +/-?)
  • depth_max: filter by depth from surface (which direction +/-?)
  • stats: a vector of functions as strings like: mean, min, max, stdev, hi90, lo10

Channel Islands Sanctuary as example AOI

image

You can quickly read this noaa-onms/onmsR:sanctuaries.geojson to pull Channel Islands as an example AOI with the following R code:

sanctuaries_geo <- "https://github.com/noaa-onms/onmsR/raw/12a87dfd4b90f2e3009ccb4913315fb2df7afddc/data-raw/sanctuaries.geojson"

cinms_ply <- sf:st_read(sanctuaries_geo) %>%
  dplyr::filter(nms == "CINMS")

cinms_txt <- sf::st_text(cinms_ply$geometry)

2. Extract from interpolated surface

Lots of geostatistical methods here:

  • IDW: inverse distance weighting
  • kriging

References:

@bbest
Copy link
Contributor Author

bbest commented Feb 9, 2022

@cdobbelaere,

You can use oceano-bottle.Rmd and set path to Google Drive folder calcofi - Google Drive where it's sync'd to your local machine (using Download - Google Drive)

@bbest
Copy link
Contributor Author

bbest commented Feb 10, 2022

See #3 for more AOIs

@bbest bbest changed the title visualize oceano bottle data visualize oceano bottle data: temp, o2, oa, dic Feb 17, 2022
@bbest bbest changed the title visualize oceano bottle data: temp, o2, oa, dic viz oceano bottle data (temp, o2, oa, dic) Feb 17, 2022
bbest added a commit that referenced this issue Feb 17, 2022
bbest added a commit that referenced this issue Apr 30, 2022
bbest added a commit that referenced this issue May 1, 2022
bbest added a commit to CalCOFI/api that referenced this issue May 2, 2022
@bbest bbest added this to Management Oct 30, 2023
Sign up for free to join this conversation on GitHub. Already have an account? Sign in to comment
Labels
None yet
Projects
Status: No status
Status: No status
Development

No branches or pull requests

2 participants