-
Notifications
You must be signed in to change notification settings - Fork 895
New issue
Have a question about this project? Sign up for a free GitHub account to open an issue and contact its maintainers and the community.
By clicking “Sign up for GitHub”, you agree to our terms of service and privacy statement. We’ll occasionally send you account related emails.
Already on GitHub? Sign in to your account
Trace methods of all classes under a package by otel.instrumentation.methods.include=my.package.**
#2574
Comments
It certainly can be added, but we have to think about corner cases here. Do you want ALL methods or only public ones? What about methods inherited from superclasses? What if one instrumented method directly calls another one, do you want 2 spans? This is quite dangerous feature that may result in millions of spans... |
Only the public methods are included.
Only the lowest method's execution is instrumented.
Yes, in this case, I want 2 spans. This may produce many spans. If it's properly used then we can see a trace like:
This is helpful in case that we don't want our core domain module to depend on Open-telemetry's APIs. |
If you don't want to depend on otel APIs you can always add your own |
Good suggestion! Thanks for your info. |
Class level annotations aren't supported? |
I'd like to write my own aspect to handle my application's tracing to COMPLEMENT the otel javaagent, but it's unclear to me how to proceed after reading https://opentelemetry.io/docs/java/manual_instrumentation/ |
I got some help from @anuraaga and solved it here: |
Would be handy |
This would be very helpful. Temporarily turning on packages with regexes would be very useful to debug whenever a performance issue is not located in the currently included methods. APM services such as AppDynamics only export these in-depth spans whenever the trace is problematic (slow or exception). I think this is a great strategy because it saves money (only a small percentage should be slow or error) and gives in-depth information for issues without having to manually instrument or manually configure specific methods/classes. I think what is considered "slow" and "error" can be configured. I think they also "crop" the spans to show only the relevant pieces involed in the slowness or the errors, that way 1000 spans won't be sent for each problematic trace. Further sampling could be done via the collector. This is much easier said than done, but it is an elegant solution that covers what 99% of users need. Configuring specific methods or classes can be brittle, specially when the code that is instrumented is located in third party libraries that can change their class structure any time. |
profiling is generally my go-to when the performance issue is not located in the currently included methods. the OpenTelemetry community kicked off Profiling work in 2022, with one of the goals being to correlate Profiling with Tracing, which would allow you to dig into a specific slow request and look at an execution profile for it |
Based on the information here (thanks) I created this repository specific to spring boot, with a working aspect-based instrumentation of all public methods inside
The extension works now, so feel free to grab it and use it as a starting point for your use case. |
Is your feature request related to a problem? Please describe.
I'd like to trace all the classes/methods under a package recursively using the
otel.instrumentation.methods.include
system property, without naming every class.I think this is a really powerful feature if we can achieve such transparency for in-process tracing like this, as in many situations, we hope that our core domain's module is agnostic of how they are traced.
So we can no longer depend on the open-telemetry instrumentation API's
@WithSpan
.Describe the solution you'd like
Given I have a Spring-Boot project as below
I want to set
-Dotel.instrumentation.methods.include=com.example.demo
or-Dotel.instrumentation.methods.include=com.example.demo.**
to include all my application classes for tracing.Could we achieve this?
This feature may produce many spans and is considered dangerous.
However, I think we can emphasize its consequences to the users,
but be able to support the full transparency if the user asks to.
If it's properly used then we can see a trace like:
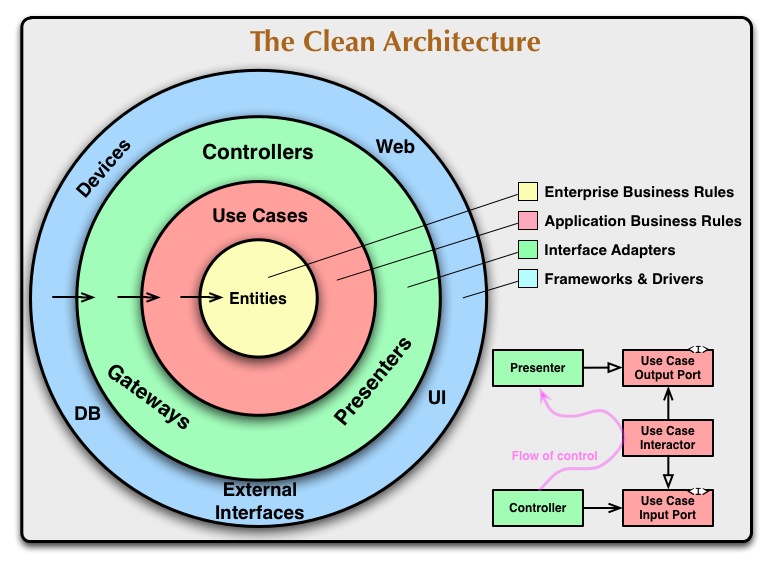
(In a Clean Architecture style)
Alternatives
Consider that there may be so many spans produced,
the alternative is that Include only the Spring bean's methods under a package*
Thanks for your time on my post.
The text was updated successfully, but these errors were encountered: