Tutorial 2 ERP Plotting and Measuring
In the first section of the ERPLAB tutorial, we demonstrated loading EEG data, assigning data to bins, and making a new ERP dataset with these bins.. Here, we look at ERPLAB functions for plotting and measuring this ERP dataset.
With an ERP set loaded, the EEGLAB window will show entries in ERPsets menu. Functions will primarily apply to the selected ERP set, which is S1_ERP.erp below. If you don't have an ERPset loaded already, hit ERPLAB menu > load existing ERPset.

ERPsets menu showing that S1_ERP is loaded and active.
ERPLAB has many options for plotting ERP data. In order to explore your ERP dataset, showing different channels and bins, and scrolling through them quickly, we have the ERP Viewer. To produce ERP plots at figures, which can be tailored in appearance and exported as PDFs, we have the ERP Plot Waveform tool. For recording specific values from the ERP, such as mean within a time range, we have the ERP Measurement Tool. Let's examine each of these in turn.
To run, hit ERPLAB menu > ERP Viewer.

The ERP Viewer is useful for quickly exploring you ERP data. Note that, using the button selectors on the right (<,>), you can choose which of your ERP bins to plot, or tick the corresponding box to plot all Bins. Likewise, for those selected Bins, you can plot data from any single EEG channel, or all EEG channels (Channel 1, F3, is plotted first in the above example).
The time range can be customized in the top right. By default, this will first select the entire epoch. With the S1_ERP from the example datasets, an epoch length of -200 ms to +800 ms was chosen, which rounds down the 798 ms shown above.
The Y range can also be changed in the top right. Typically, this is µV. Enter two numbers here to change the Y range, in the format min max, so -20 20 to show from -20 µV to +20 µV.
Note that the panel on the on the lower left shows information about the current plot. Additionally, you can click the tickbox to enable 'Adjust measurement time`, click on a new time point, and information will be updated to show the time and value there.
Here, we select all Bins, Channel 6 (P4), and click on 442 ms:

For more involved plots, we have the Plot ERP Waveforms tool.
Hit ERPLAB menu > Plot ERP > Plot ERP Waveforms.

Here, a new Matlab figure will be produced, plotting your ERP data, with options set as needed.
By default, all Bins will be plotted, as shown in the top left. You can change this, entering the index number of desired bins or bin ranges (as 1:4 for all bins 1 thru 4) in the text entry field on the top left.
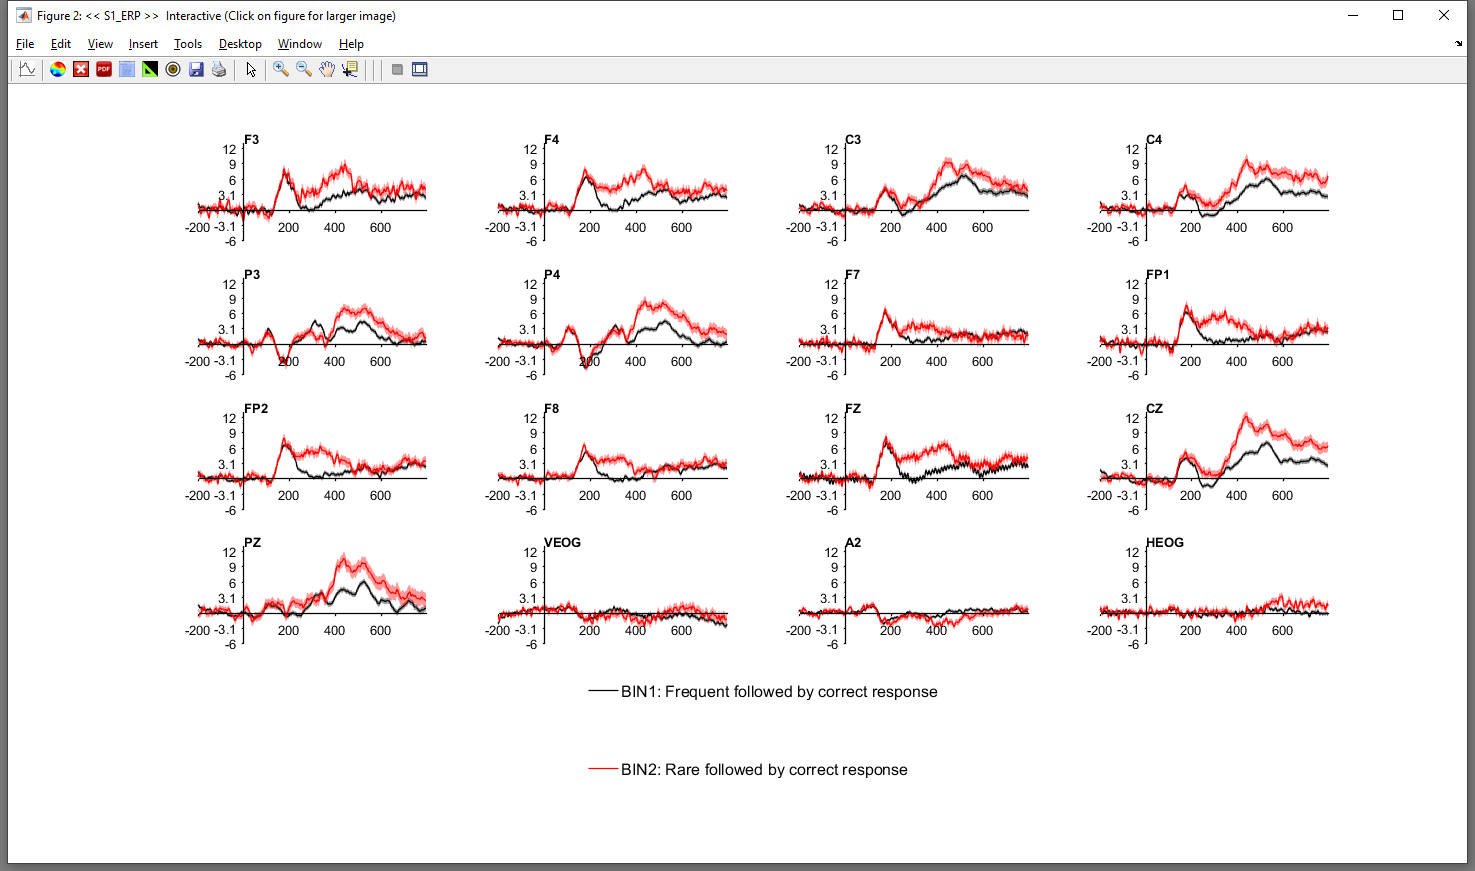
The time range, amplitude Y range, and plot ticks for each can be tailored on the panel on the left. We also see an option for plotting show standard error on the lower left. For standard error, we suggest plotting at size x1 and transparency of 0.6.
Plotting S1_ERP with these paramenters gives: