User guide: Reports
Reports are collections of charts that can be shared with users. This guide explains how to create, view, and share them.
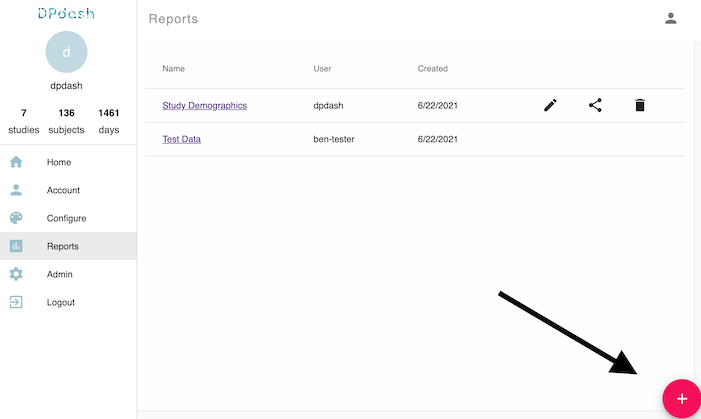
To create a new report, navigate to the Reports page in the DPdash sidebar and click the red "Plus" icon in the bottom right corner.
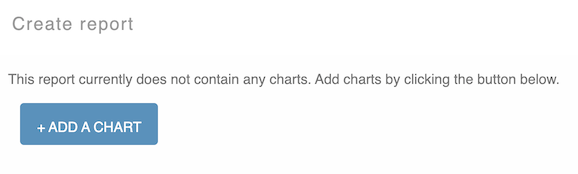
To add a new chart to the report, click the "Add a chart" button:
Select a chart type, and fill out the required fields. Here is a quick explanation of the fields for a Bar chart:
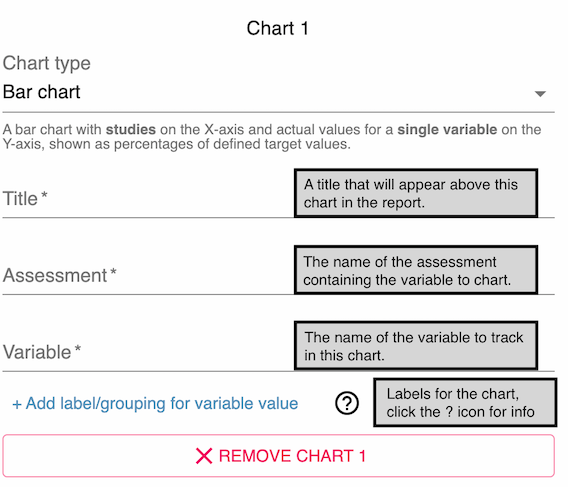
You may add as many different charts to a report as you wish, perhaps tracking different variables or with different label groupings. You may also remove a chart with the "Remove [chart]" button.
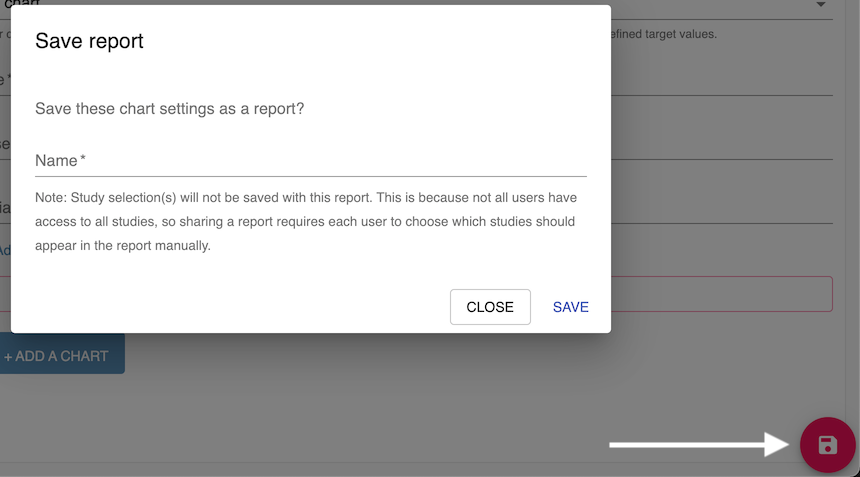
You may then save the report by clicking the red floppy disk icon in the bottom right corner, entering a name, and clicking "Save".
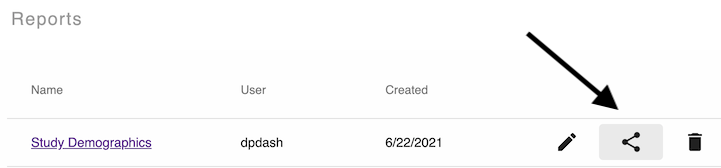
To share a report, navigate to the Reports page in the DPdash sidebar. Locate the report you wish to share, and click the sharing icon in its row.
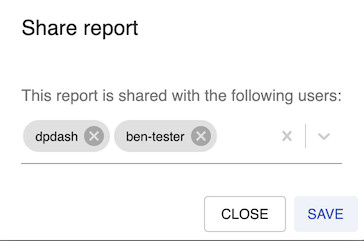
Select the users with whom you wish to share the report, and click "Save".
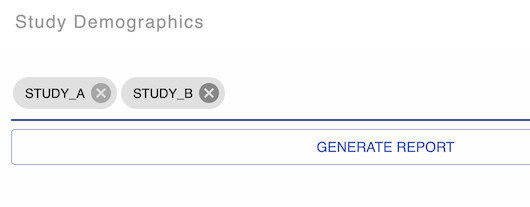
To view a report, navigate to the Reports page in the DPdash sidebar and click on the name of the report you wish to view.
Then, select one or more studies for which you wish to view this report, and click "Generate report":