This code was developed for the Oregon State University High Altitude Liquid Engine (HALE) rocketry team as a frontend for the Vertical Test Stand control panel. The GUI design was based on the original LabVIEW control panel designed by Karsen Burson.
The Python GUI is built in Python 3.9, using the NumPy, Matplotlib, Tkinter, and Pillow libraries. After installing these libraries, run the code using:
python panel_init.py
The file panel_init.py is where all three panels and their elements are declared and initialized. The code calls the Interface constructor to create an object that will contain the Panel objects, then adds each panel and their respective elements. New elements should be added here.
The Tkinter elements that comprise the three panels are abstracted behind Python classes to simplify the process of creating these elements. The constructor and methods for the class Element define attributes that are common to all Tkinter elements on the panel, and each derived class(BarChart, Chart, Image, IndicatorLight, LoggingBox, NumericDisplay, PushButton, Rectangle, ToggleButton, ValveIndicator) defines attributes specific to that element, and inherits all members and attributes of the base class. All of these element classes are consolidated and imported as a module through the file HALE.py. To add a new element, the call to the respective constructor in panel_init.py only needs to specify parameters relevant to that element, such as text or color, and the constructor will handle the initialization of the element and display it on the panel.
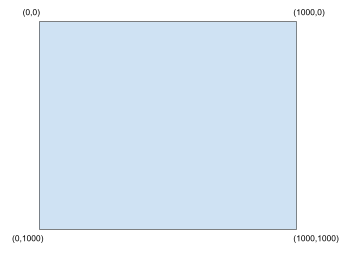
A relative coordinate system is used to position elements on a given panel. The arguments pos_x, pos_y, size_x, and size_y that are passed to the element constructor are with respect to a 1000x1000 coordinate system regardless of window size, which is then resized by the methods inherited from the Element base class to the dimensions given in pixels when initializing the panel in panel_init.py. This allows the panel to be initialized at any size with the elements always repositioned at the correct locations relative to the given panel dimensions.
NOTE: Panel sizes are in absolute pixel dimensions, Element positions and sizes are in normalized 1000x1000 dimensions.
The element positioning coordinate system:
The base class from which all other element classes are derived. This class exists to handle attributes common to every element (z, size_x, size_y, pos_x, pos_y, anchor, refresh_interval) and displays the element on the panel, and should never be used directly when initializing a new element. For each following Element child class, only the attributes specific to that child class will be described.
The calculate_positions() method uses the normalized 1000x1000 coordinate system to convert the relative size_x, size_y, pos_x, pos_y and anchor of the element to an absolute size and position for the given panel dimensions. Elements can then make use of abs_size_x, abs_size_y, abs_pos_x and abs_pos_y to perform absolute positioning. The anchor determines whether the position specified is relative to a specific corner of the element or its center. For example, an element with its anchor specified as HALE.AnchorPoints.CENTER, positioned at (500,500) will have its center at the panel’s (500,500). By default the anchor is set to the top-left of an element. Consult enums.py for valid anchor values.
The display_content() and update() methods are overridden by the child classes so that each element type displays and updates itself according to its given purpose, if necessary. These live-updating element classes use the attributes get_data and refresh_interval. get_data is a function passed to the constructor (of elements that accept data) that returns data with which to update the element, the format of which is specified for each element below. refresh_interval is a number given in milliseconds at which data is polled periodically. If a refresh_interval is not specified, the element will not call its get_data function except during initialization.
z determines the front-to-back layering order of elements. Consult enums.py for valid z values.
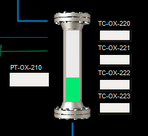
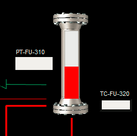
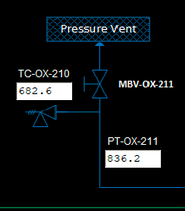
Visually updates the tank diagrams in the P&ID on the Indicator Panel.
HALE.BarChart.__init__(self, *, starting_value=50, min_value=0, max_value=100, barcolor="#11FF11", bgcolor=None, get_data=None, **kwargs):
A bar is created with the specified minimum and maximum values to display, and the specified bar and background color. The value it displays updates according to the data received from get_data() at the specified refresh_interval.
get_data() format:
The get_data function passed to the constructor must return a numerical value to be displayed. If this value is not within the range [min_value, max_value], it is truncated to fit within that range.
Displays live-updating Matplotlib charts on the Engine Panel.
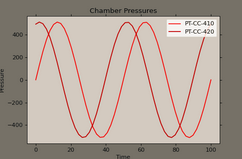
HALE.Chart.__init__(self, *, title="Chart title", font="Arial Bold", xlabel="Time", max_points=10, lines=[("Series 1", "#FF0000")], ylabel="Pressure", text_color="black", get_data=None, font_size=24, **kwargs):
The lines parameter determines the color and titles of the different lines on the chart. Consult the code for examples. max_points is the number of data points displayed on the graph at one time.
get_data() format:
The get_data function passed to the constructor must return a tuple of numerical values representing the most recent measurement for all lines on the chart. For example if the lines parameter is [("Volume", "#FF0000"), ("Temperature", "#FFFF00")], get data must return a tuple (float, float), with the first float being the most recent volume value and the second being the temperature. X-axis values are automatically set to the time at which the data was received by the chart.
Imports an image file, performs a resize, and displays the image.

HALE.Image__init__(self, *, file="./hale.png", resize_x=None, resize_y=None, **kwargs):
The size_x and size_y arguments, common to every element, use the normalized 1000x1000 coordinate system, and are used to resize the image to the appropriate size.
Emulates an LED indicator light on the panel.
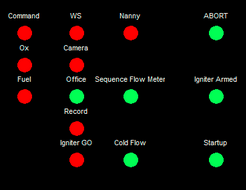
HALE.IndicatorLight.__init__(self, *, text="Indicator Label", starting_color="green", text_color="white", font=("Arial", 12), bgcolor=None, get_data=None, **kwargs):
Creates an LED with the specified colors and label text, and updates according to the data received from get_data() at the specified refresh_interval. If text==None, the LED is created without a label and fills to the exact size specified by size_x and size_y.
get_data() format:
The get_data function passed to the constructor must return the color to be displayed by the LED as either an RGB hex string (e.x. “#03ADDDD”) or the name of the color. A chart with color names can be found here: http://www.science.smith.edu/dftwiki/index.php/Color_Charts_for_TKinter
A logging box that can display alerts or system messages.
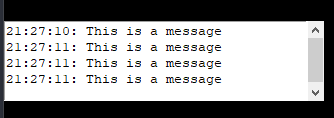
HALE.LoggingBox.__init__(self, *, font=("Arial", 12), text_color="black", bgcolor="white", **kwargs):
Creates a logging box to display messages. Messages are added to the box by passing the add_message(text="Message text") method of a LoggingBox object as an event handler for another element (ie, a button).
Displays a numerical value.
HALE.NumericDisplay.__init__(self, *, text="Indicator Label", starting_value=0, text_color="white", font=("Arial", 12), bgcolor=None, get_data=None, **kwargs):
Creates a numeric display with the given label text, label text color and font, and starting value. The value displayed updates according to the data received from get_data() at the specified refresh_interval.
get_data() format:
The get_data function passed to the constructor must return a float containing a numeric value to be displayed.
Button that generates an onclick event when clicked.
HALE.PushButton.__init__(self, *, onclick=None, text="Button", font="Arial Bold", text_color="black", bgcolor="white", font_size=24, **kwargs):
Creates a push button colored with bgcolor, labelled with the specified text.
onclick() event handler:
If an onclick function is passed to the constructor when the push button is initialized, the function will be called every time the button is clicked. This function takes no parameters.
Draws a rectangle on the panel. This was used as part of the background in the center Command Panel.
HALE.Rectangle.__init__(self, *, color="green", **kwargs):
Draws a solid rectangle at the specified size and position in the given color. This can be used to create backgrounds by changing the z parameter.
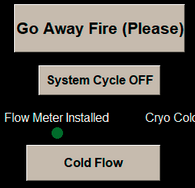
Toggle button with an on state and off state, and separate event handlers for both.

HALE.ToggleButton.__init__(self, *, on_toggleon=None, on_toggleoff=None, off_text="OFF", on_text="ON", font="Arial Bold", font_size=24, off_text_color="white", off_bgcolor="#ff0000", on_text_color="white", on_bgcolor="#339933", starting_state=enums.ToggleStates.OFF, **kwargs):
Creates a toggle button with separate label text, text color, button color, and toggle event handlers for both on and off states.
HALE.ToggleButton.get_state():
Returns the current state of the toggle button to be read by the corresponding valve indicator.
on_toggleon() and on_toggleoff() event handler:
If an on_toggleon or on_toggleoff function is passed to the constructor when the toggle button is initialized, the corresponding function will be called every time the button is toggled to a different state.
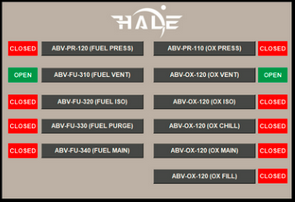
Indicators next to their respective control buttons that show the position of each valve and whether it is actuated.
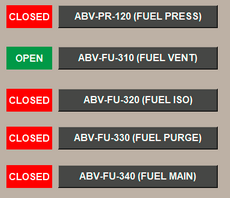
HALE.ValveIndicator.__init__(self, *, state=enums.ToggleStates.OFF, get_data=None, **kwargs):
Draws a rectangle with color and text that changes depending on the state received from get_data() at the specified refresh_interval.. The indicators currently update based on the state of the toggle button that controls the corresponding valve, using the ToggleButton.get_state() method, but can be changed to update based on data from limit switches or other hardware by changing the get_data function passed in when the element is initialized.
get_data() format:
The get_data function passed to the constructor must return either enums.ToggleStates.OFF or enums.ToggleStates.ON.
To make integration of the backend as simple as possible, all of the functions used for get_data, on_click, on_toggleon and on_toggleoff are defined in separate files, input_handlers.py and output_handlers.py. Examples of function names, corresponding panel elements, and format of data returned (if relevant) are listed in the table below-- this is not meant to be an exhaustive list, as all functions of a given category will operate similarly.
All of the function names are made to be as close to the text displayed next to them as possible. For example, the function igniter_led corresponds to the light on the main panel, while the function igniter_armed_led corresponds to the light on the indicator panel.
| Function Name | Panel Element | Data Format |
|---|---|---|
igniter_led |
Command Panel Igniter Indicator Light | Hexadecimal RGB string |
ox_main_valve_led |
Engine Panel Ox Indicator Light | Hexadecimal RGB string |
TC_OX_210_numdisplay |
Indicator panel TC-OX-210 Numeric Display | Numeric value |
fuel_barchart |
Indicator panel red bar inside image | Numeric value |
ToggleButton elements have toggle-on and toggle-off functions defined. PushButtons only have one onclick function.
| Function Name | Panel Element |
|---|---|
water_suppression |
Main Panel Water Suppression PushButton |
engine_start_up |
Main Panel Engine Start Up PushButton |
cycle_fuel_vent_on |
Main Panel Cycle Fuel Vent ToggleButton |
cycle_fuel_vent_off |
Main Panel Cycle Fuel Vent ToggleButton |