This is a research project on the dataset which contains data of all the measures taken by different countries to control the Covid-19 Pandemic
Team Name: Team RPM
Team Members:
- Nisha Ramrakhyani
- Zalak Panchal
- Punit Mashruwala
Project Introduction: The project mainly focuses on the impact caused by different measures taken by different countries to control the spread of Covid-19. We have a dataset of around 22k records of measures taken by different countries along with the dates they started implementing these measures. We'll augment this dataset with the dataset of the number of Covid cases in each country each day. Our aim is to analyze the rise/fall in the number of Covid-19 cases before and after taking the necessary measures.
Research Question:
- How did the different measures taken by different countries to control the Pandemic impact the total number of Covid-19 cases?
Relevant Domain Information:
- https://www.acaps.org/covid-19-government-measures-dataset
- https://en.wikipedia.org/wiki/Coronavirus_disease_2019
Data Sources:
- https://www.acaps.org/covid-19-government-measures-dataset
- https://ourworldindata.org/covid-cases
- https://medium.com/@wvsharber/exploratory-time-series-analysis-and-prediction-with-facebooks-prophet-6a28015d551e
- https://towardsdatascience.com/covid-19-outbreak-prediction-using-machine-learning-algorithm-ce5641bd55bf
Approach:
- Data understanding and EDA:
Introduction to the Dataset: We are working on a dataset that contains records of the measures taken to control the spread of the Novel Coronavirus which was later renamed to Covid-19.
We have chosen 16 countries('Australia', 'France', 'Germany', 'India', 'Italy', 'United States', 'New Zealand', 'Canada', 'Norway', 'Sweden', 'United Kingdom', 'Mexico', 'Singapore', 'Spain', 'Sri Lanka', 'Belgium') for our research.
Our Dataset contains following columns:
- ID - Unique Number
- ISO - iso3 code
- COUNTRY - Name of the country
- REGION - Continent
- LOG_TYPE - Introduction / extension of measures, Phase-out of measures
- CATEGORY - Measures Category
- MEASURE - Various method or rules applied to control the spread of the virus
- TARGETED_POP_GROUP - Yes or no in dropdown
- COMMENTS - Comments or any others explanation for the measures
- NON_COMPLIANCE - Additional rules to applied like fines etc.
- DATE_IMPLEMENTED - Start of the measures in the country or part of the country
- SOURCE - Data source for the mentioned Measures
- SOURCE_TYPE - Data source type for the mentioned Measures
- LINK - Link for the given information or data
- ENTRY_DATE - Entry date of the given measure in the dataset
We used another dataset for modeling to develop predictive model for forecasting the number of Covid cases across the world and to perform exploratory analysis of number of Covid cases across the world and no. of deaths across the world.
Below are the details of this dataset: https://ourworldindata.org/coronavirus-testing
For more detail, please check this readme file:
https://www.acaps.org/sites/acaps/files/key-documents/files/acaps_-_covid-19_government_measures_dataset_readme.pdfEDA:
We have done EDA on our covid-19 dataset to analyze how different countries prepared themselves to fight the virus, after performing the initial data preparation.
More information is available in the notebook in the folder with the name eda_code or in the pdf file with the name: EDA - Jupyter Notebook.pdf
Few Examples of EDA
- Data Preparation:
- We have added four new columns 'covid_cases_per_date' , 'population' ,Total_Covid_cases' and *Total_no_of_tests' to the given dataset. The intention of adding these columns was to see the impact of different measures taken by different countries to control the spread of the Pandemic. We got this data from Wikipedia
- From the 18 columns in the dataset, we chose the following columns that seemed important to work on:
- COUNTRY
- CATEGORY
- MEASURE
- COMMENTS
- DATE_IMPLEMENTED
- covid_case_per_date
- population
- Total_Covid_cases
- Total_no_of_tests
- We did the log normalization on the covid_cases_per_date column to normalize the column as it had a lot of variances.
- We also calculated number of COVID cases per millions population.
- Converted datatype of 'date implementation' column from OBJECT to DATETIME
- We handled the missing data. We had around 60 records with missing values. And since the column 'DATE IMPLEMENTATION' had missing values, we dropped the records with missing values. It would have been incorrect to compute these missing values.
- We calculated the number of days from DATE to plot the number of Covid cases against number of days.
- This way the dataset was prepared for EDA and modeling
- Machine Learning :
- Our dataset contains time-series data.
- We have built two models for our dataset. - We have built predictive model using the time series analysis and forecasting tool from Facebook called Prophet with Python to perform Exploratory analysis of percent positive COVID cases in Australia. - We have built a model to forecast the number of COVID cases across the world.
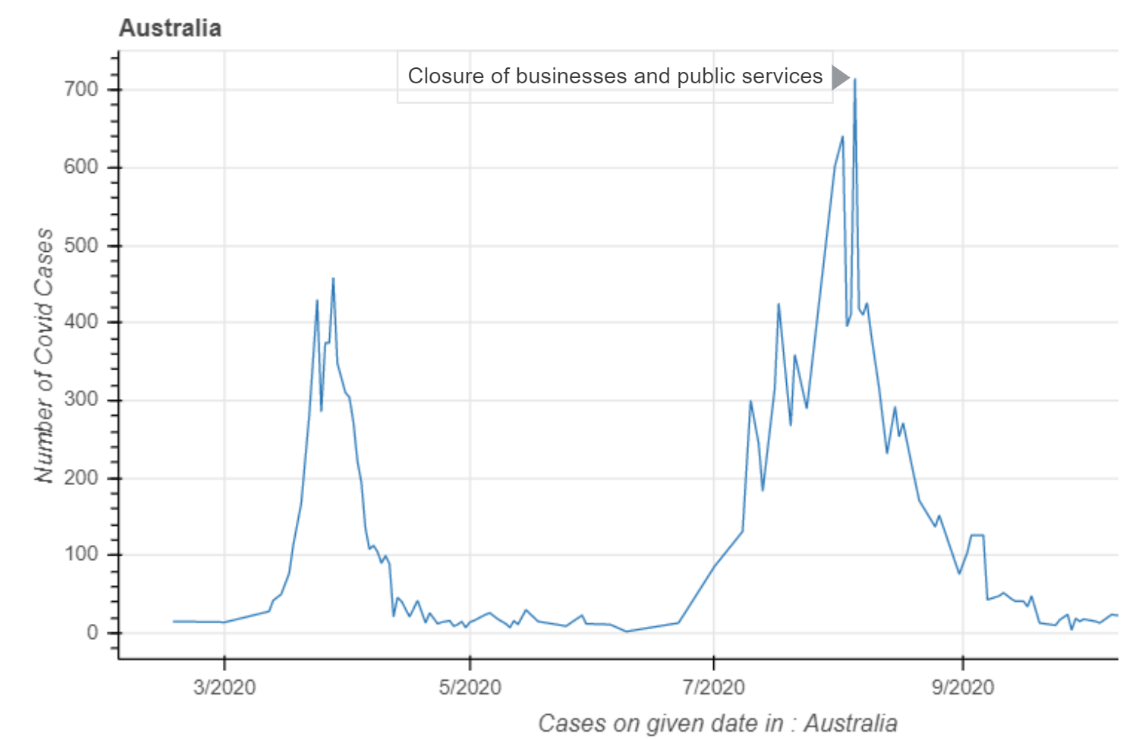
- In the first predictive model, we have forecasted the Rate of Positivity taking into account Interventions in Australia. For example, Australia took the measure "Border closure" on 03/20/2020.So we have considered such intervention to forecast the rate of positivity.
- We have used the Prophet class and performed cross-validation on it. After calculating metrics such as MAE, MSE, or RMSE with built-in functions, we have plotted the estimated errors across the horizon.
- More information is available in the notebook in the folder with the name eda_code or in the pdf file with the name: [EDA - Jupyter Notebook.pdf]
- Coronavirus spread has conducted the society under the edge of loss in social lives. Additionally, it is crucial to investigate the transmission growth ahead and predict the future occurrences of the transmission. So, In the second prediction model, we have forecasted the number of COVID cases across the world by building SVM model and Polynomial regression model.
- The metrics used for SVR and Polynomial regression model are mean absolute error and mean squared error: SVR: MAE: 20024573.832694203 MSE: 586909261681649.8 Linear Regression: MAE: 760076.3281707081 MSE: 1467099793394.4988
- Evaluation:
- In conclusion, the method of Polynomial Regression (PR) generated a minimum Root Mean Square Error (RMSE) amount over other methods in projecting the COVID-19 transmission.
Known Issues (Problems with Data Preparation and Prediction)
- We did not have enough data to work on our research, so we augmented two datasets.
- The data for different countries was inconsistent.
- We had to deal with lot of missing data.
Conclusion
- This project gives insight about how different measures taken by different countries impacted the growth rate of COVID cases.
- We learned how to deal with time-series data and we were able to build predictive model to forecast the number of COVID Case across the world.
Future Work
- We can perform association rule analysis on this dataset.