Add coordinates from inertial frame to grid class#578
Add coordinates from inertial frame to grid class#578rafmudaf merged 41 commits intoNatLabRockies:developfrom Bartdoekemeijer:feature/grid_in_inertial_frame
Conversation
|
Also see my comments in #579. |
|
Just merged in latest develop branch. |
… setting relative to wd
…tion the default behavior
|
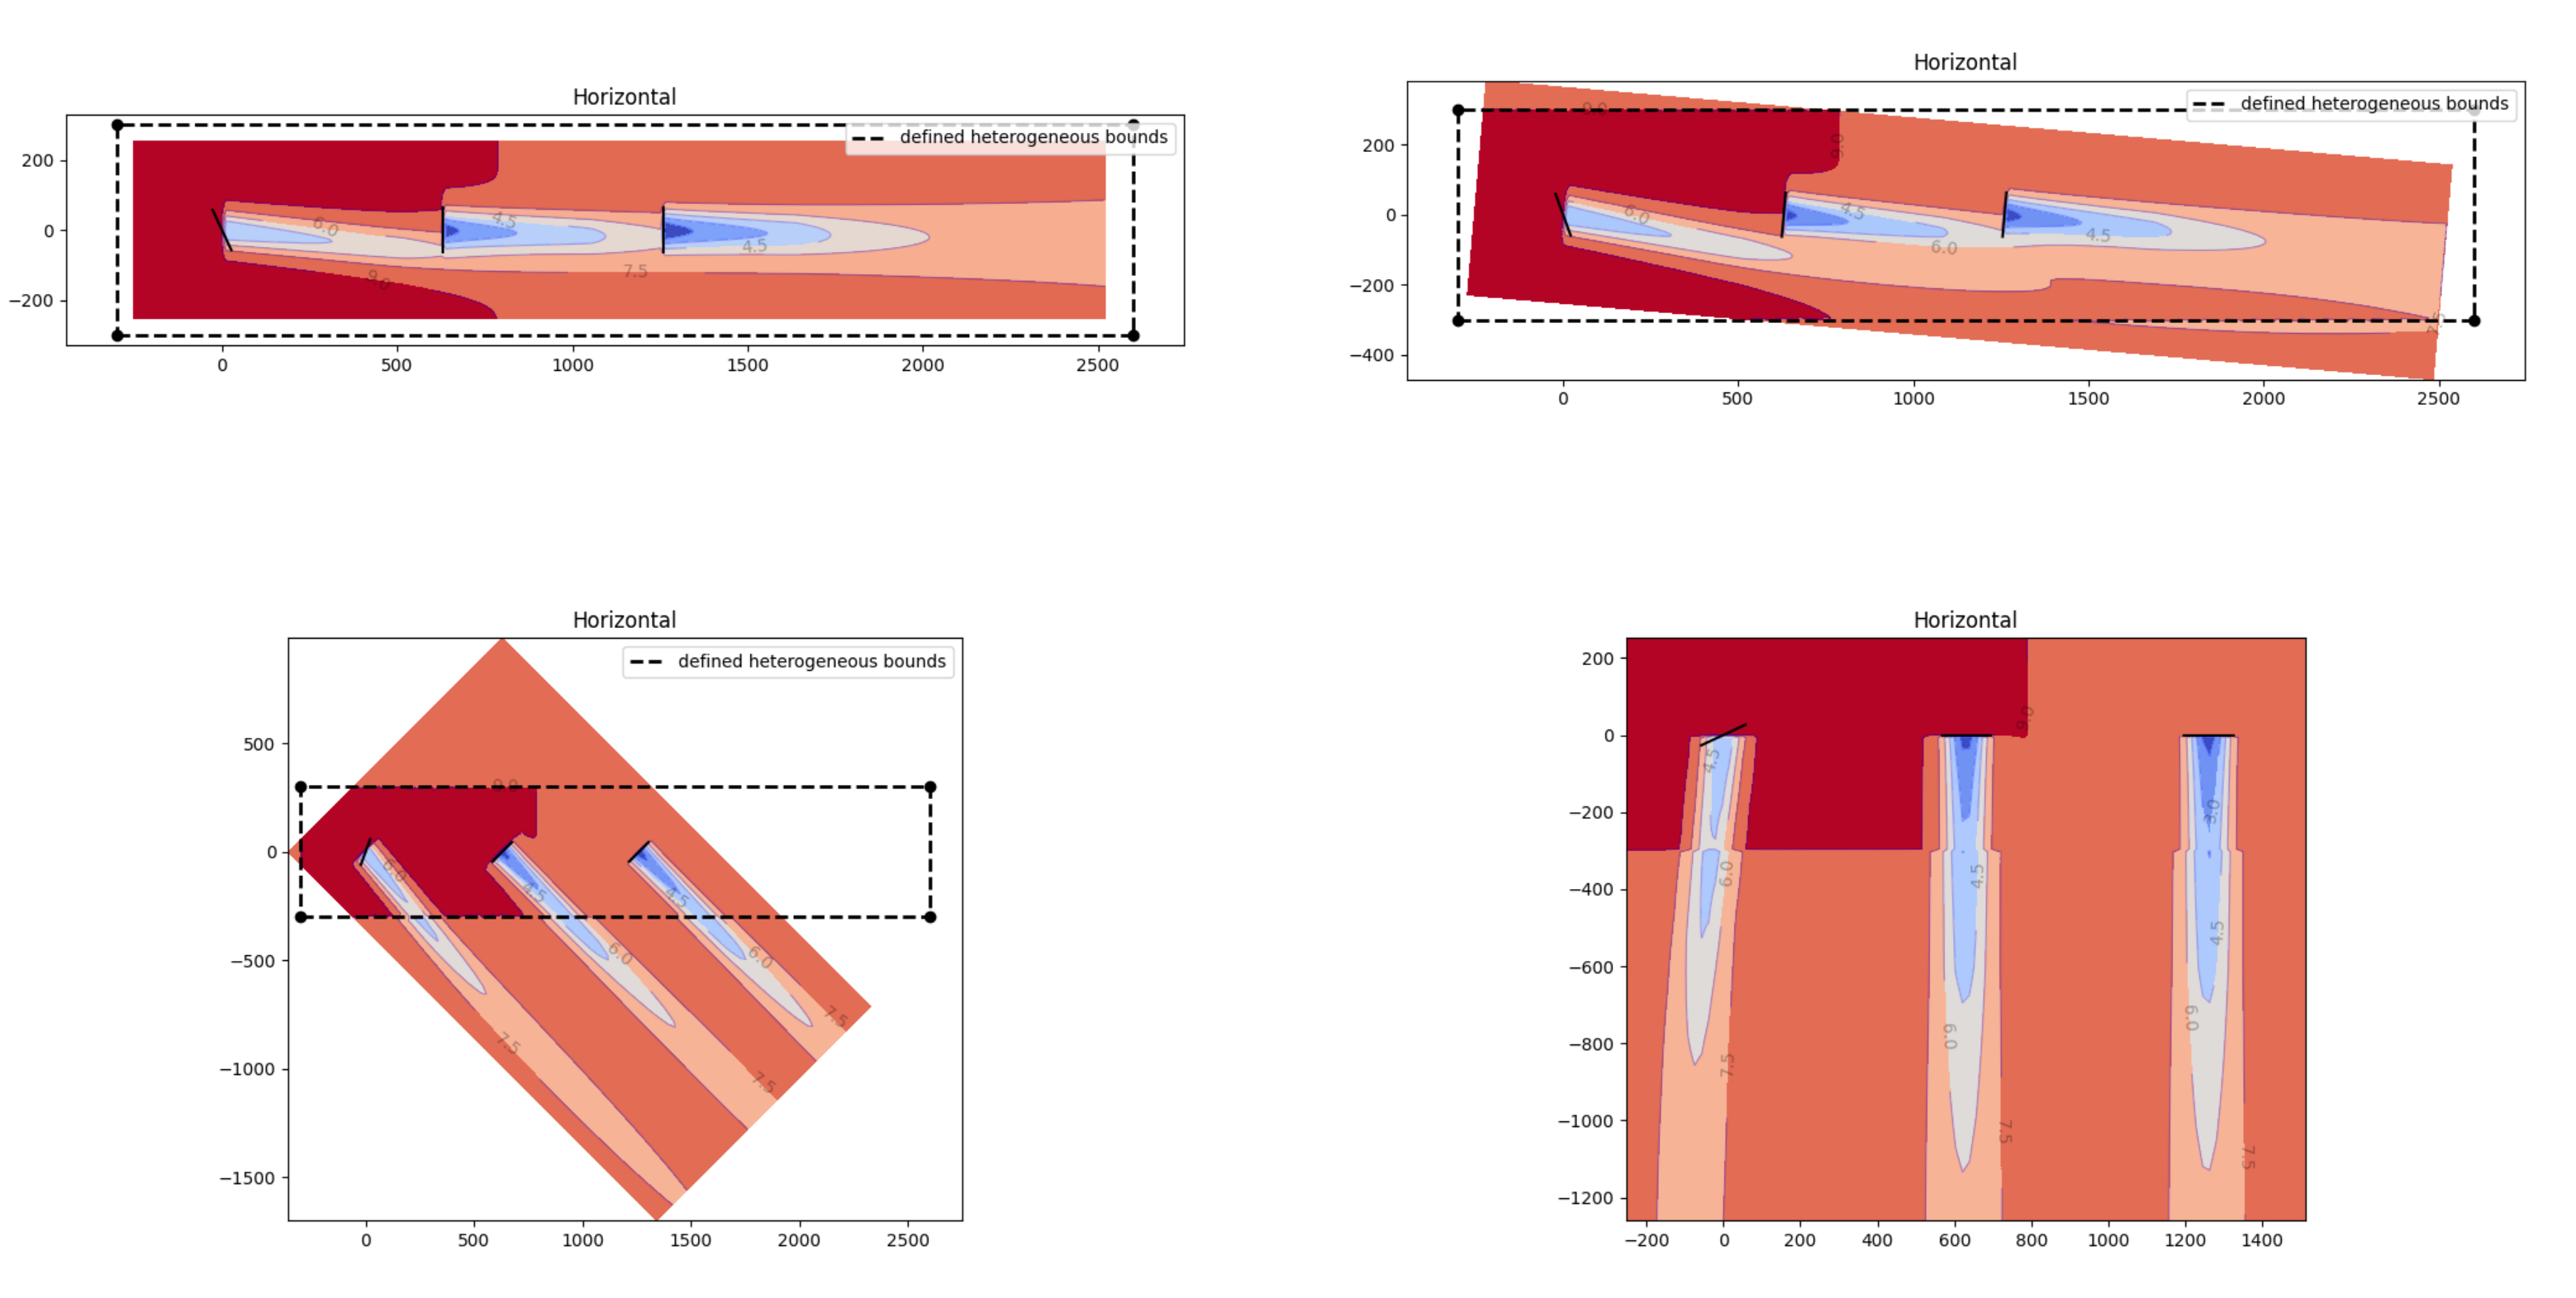
@Bartdoekemeijer @rafmudaf @paulf81 Hey all. I've gone through the PR and made a variety of updates. Thanks for all your work on this Bart! I think it is a really nice addition. The major changes are that the default plotting behavior is now to display the flow field as rotated to the defined wind direction, instead of the 270 degrees used previously. Also, I addressed the issue identified by Bart in #579 by making sure the Through this process, I re-worked the heterogeneous workflow so that the user defines an I also made changes to how the heterogeneous flows get plotted, such that the user-defined bounds for the het map are displayed by default on any plot that shows heterogenous flows. Additionally, I have removed the nearest-neighbor interpolation that previously occurred outside the user-defined heterogeneous inflow area and used a fill value of 1.0 for the speed ups such that this region is now set to be equal to freestream. This removed a good chunk of code and simplified the whole calculation. I have put together an example of this, code and plots below, that demonstrates the new code behavior for 4 different wind directions. Note the option to remove the het map bounding box in the bottom right plot. Please check and provide feedback.
|
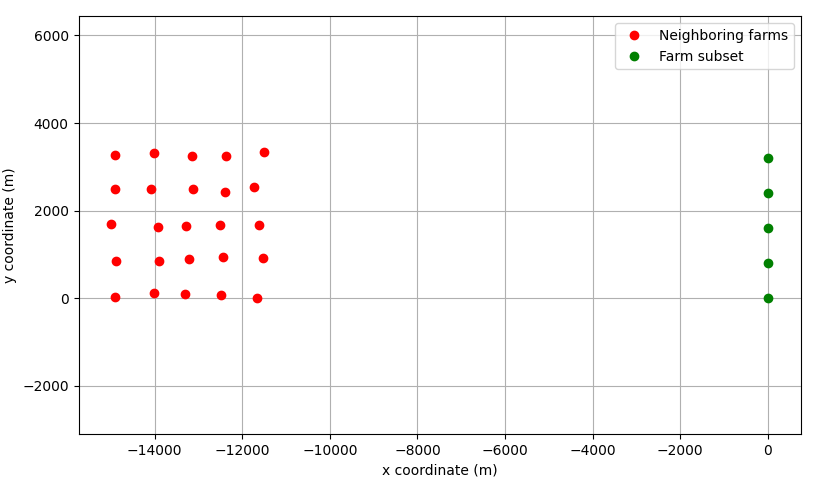
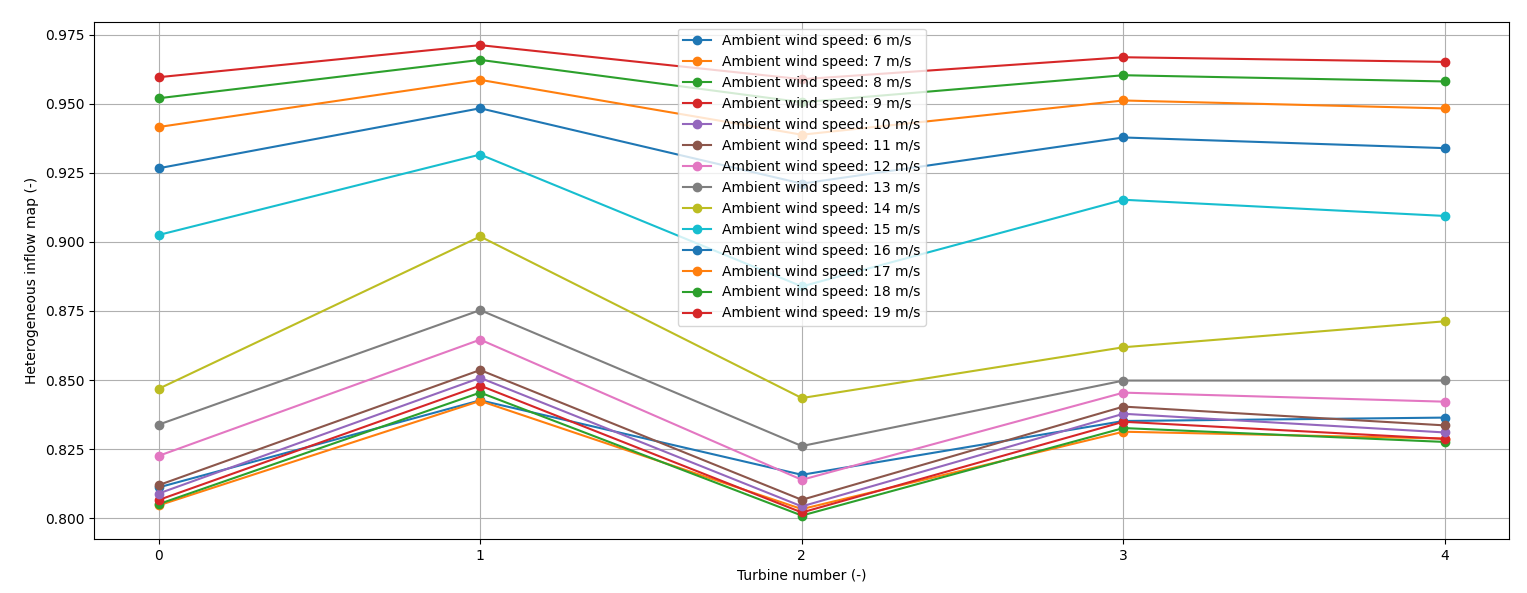
That's right. The higher the ambient wind speed, the lower the thrust coefficient of neighboring farms, and
This confirms that, the higher the wind speed, the lower |
|
Wow, thanks for sharing that @Bartdoekemeijer! That is really interesting. I believe the internal consensus over here (@paulf81 and @rafmudaf can confirm) is to close out this PR where it is, and open up a new issue to tackle adding the heterogeneous input dependency on wind speed. |
# Conflicts:
#	floris/simulation/grid.py
#	floris/tools/floris_interface.py
| turbulence_intensity: float = field(converter=float) | ||
| reference_wind_height: float = field(converter=float) | ||
| time_series : bool = field(default=False) | ||
| het_config: dict = field(default=None) |
There was a problem hiding this comment.
Agree that this is a more descriptive name and will more clearly indicate its purpose, I say switch it
There was a problem hiding this comment.
My only reservation is that we use the term "heterogeneous" pretty regularly throughout the code, so I kind of like having some indication that this is related to heterogeneity in the name. What do you think about heterogeneous_speed_ups_map? A little long and clunky...
There was a problem hiding this comment.
Looking into this a bit more, I'd update my recommended name to heterogeneous_inflow_config. In my mind, the dict is more of a data structure than a mapping of key-value pairs. However, I think that the "speed_ups" key should instead be named "speed_multipliers", to be more explicit about how the speed-up is applied (as a multiplier, as opposed to an addend).
There was a problem hiding this comment.
@misi9170 I like it. If we support heterogeneous wind directions, that will logically fit into heterogenous_inflow_config also. I think x/y_loc should be simply x/y since the _loc doesn't add much clarity. It's reasonably obvious that these are the locations of the speed multipliers.
Here's where we're at:
heterogenous_inflow_config = {
    "speed_multipliers": [1.0, 2.0, 3.0],
    "x": [ -300.0, 300.0, -300.0],
    "y": [ -300.0, 300.0, -300.0],
    "z": [     90.0,   90.0,     90.0]
}| if yaw_angles is None: | ||
| yaw_angles = fi.floris.farm.yaw_angles | ||
| if wd is None: | ||
| wd = fi.floris.flow_field.wind_directions[0] |
There was a problem hiding this comment.
This may be incorrect given the line in plot_turbines function call below that also extracts the first wind direction. Double check @bayc
There was a problem hiding this comment.
Oh I see now that this is only used to adjust the yaw angles. That's probably good to reflect in the doc string
Reducing the number of lines that were changed here to make reviewing the PR easier
| x_sorted: NDArrayFloat = field(init=False) | ||
| y_sorted: NDArrayFloat = field(init=False) | ||
| z_sorted: NDArrayFloat = field(init=False) | ||
| x_sorted_inertial_frame: NDArrayFloat = field(init=False) |
There was a problem hiding this comment.
These are added and x etc are deleted. As I understand it, x/y/z_sorted_intertial_frame are the same as x/y/z except that they're sorted. Will we need to retain x/y/z for postprocessing? For example, if you need to plot the layout with ID's based on your input, do we require to unsort x/y/z_sorted_intertial_frame?
2.
There was a problem hiding this comment.
A follow on question is whether this should be simply x/y/z with those attributes being defined (in words) the same as you would define the x/y/z_sorted_intertial_frame attributes.
| x: NDArrayFloat = field(init=False, default=[]) | ||
| y: NDArrayFloat = field(init=False, default=[]) | ||
| z: NDArrayFloat = field(init=False, default=[]) | ||
| x_sorted: NDArrayFloat = field(init=False) |
There was a problem hiding this comment.
Given the added complexity in the grids, this is a good time to document the _sorted and _sorted_inertial_frame variables. The minimum documentation would here in the docstring, and better would be to also add to the Floris_101 notebook in the docs with detailed exaplanation and code or analysis of these variables.
| fi.layout_y, | ||
| yaw_angles[0, 0], | ||
| fi.floris.farm.rotor_diameters[0, 0], | ||
| yaw_angles.flatten(), |
There was a problem hiding this comment.
Whats the shape of yaw_angles here? Previously, it was assumed that it was 3D (wind direction, wind speed, N turbines). Here, it looks like it assumed this is 1D (N turbines). Same question for fi.floris.farm.rotor_diameters below.
|
Overall, this looks like it's in pretty good shape! |
New name and key/value’s are more explicit
|
For reference, I've updated @bayc's example from #578 (comment) for the new API in this pull request. The script is below and the plots that it creates are below that. from floris.tools import FlorisInterface
import matplotlib.pyplot as plt
import numpy as np
import floris.tools.visualization as wakeviz
from floris.tools.visualization import plot_turbines_with_fi
speed_ups = [[1.2, 1.2, 1.0, 1.0]]
x_locs = [-300.0, -300.0, 2600.0, 2600.0]
y_locs = [ -300.0, 300.0, -300.0, 300.0]
# Generate the configuration dictionary to be used for the heterogeneous inflow.
het_config = {
'speed_ups': speed_ups,
'x_locs': x_locs,
'y_locs': y_locs,
}
# Initialize FLORIS with a heterogeneous inflow
fi_2d = FlorisInterface("inputs/gch_heterogeneous_inflow.yaml")
# Plot the farm for the wind direction of 270 degrees
fig, ax = plt.subplots(2, 2)
yaw_angles = np.array([[[25.,0.,0.]]])
horizontal_plane_270 = fi_2d.calculate_horizontal_plane(
wd=[270.],
x_resolution=200,
y_resolution=100,
height=90.0,
yaw_angles=yaw_angles,
)
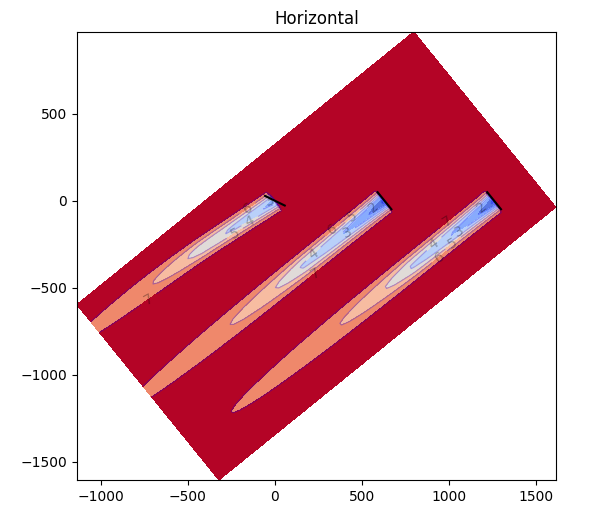
wakeviz.visualize_heterogeneous_cut_plane(horizontal_plane_270, fi_2d, ax=ax[0][0], title="Horizontal")
plot_turbines_with_fi(
fi_2d,
ax=ax[0][0],
color="black",
wd=[270.],
yaw_angles=yaw_angles,
)
# Plot the farm for the wind direction of 275 degrees
horizontal_plane_275 = fi_2d.calculate_horizontal_plane(
wd=[275.],
x_resolution=200,
y_resolution=100,
height=90.0,
yaw_angles=yaw_angles,
)
wakeviz.visualize_heterogeneous_cut_plane(horizontal_plane_275, fi_2d, ax=ax[0][1], title="Horizontal")
plot_turbines_with_fi(
fi_2d,
ax=ax[0][1],
color="black",
wd=[275.],
yaw_angles=yaw_angles,
)
# Plot the farm for the wind direction of 315 degrees
horizontal_plane_315 = fi_2d.calculate_horizontal_plane(
wd=[315.],
x_resolution=200,
y_resolution=100,
height=90.0,
yaw_angles=yaw_angles,
)
wakeviz.visualize_heterogeneous_cut_plane(horizontal_plane_315, fi_2d, ax=ax[1][0], title="Horizontal")
plot_turbines_with_fi(
fi_2d,
ax=ax[1][0],
color="black",
wd=[315.],
yaw_angles=yaw_angles,
)
# Plot the farm for the wind direction of 360 degrees
horizontal_plane_360 = fi_2d.calculate_horizontal_plane(
wd=[360.],
x_resolution=200,
y_resolution=100,
height=90.0,
yaw_angles=yaw_angles,
)
wakeviz.visualize_heterogeneous_cut_plane(horizontal_plane_360, fi_2d, ax=ax[1][1], title="Horizontal", plot_het_bounds=False)
plot_turbines_with_fi(
fi_2d,
ax=ax[1][1],
color="black",
wd=[360.],
yaw_angles=yaw_angles,
)
# Show the plots
plt.show()
|

This functionality was mostly disabled in NatLabRockies#578 but the attribute of this class was not removed
The pull request is ready to be merged, but requires review.
Feature or improvement description
This pull request adds the inertial locations of the flow fields/turbine locations in the
gridclass. With inertial, I mean the location of the turbines without rotating it to the incoming wind direction. These additional variables should also be helpful when working with heterogeneous inflow conditions. The way it seems to be implemented now, the heterogeneous inflow conditions are linearly interpolated using the rotated (wind-aligned) coordinates, meaning their physical location differs for different wind directions. I'm opening a separate issue for that. Anyway, this PR is also particularly helpful when we want to plot horizontal flow slices when fixing the plot to true north and with the turbines plotted in same location for every wind direction -- i.e., the same issue as described in #556.I have added a couple of handles to the visualization such that it can be used for plotting horizontal flow slices while fixing the orientation to true north. Note that nothing fundamentally has changed to the FLORIS simulation code, besides the exporting/calculation of a couple extra variables, so it's an easy merge.
Related issue, if one exists
@MYMahfouz provides a nice overview in #556.
Impacted areas of the software
The FLORIS
gridandvisualizationclasses.Additional supporting information
These additional variables should also be helpful when working with heterogeneous inflow conditions. The way it seems to be implemented now, the heterogeneous inflow conditions are linearly interpolated using the rotated (wind-aligned) coordinates, meaning their physical location differs for different wind directions. I'm opening a separate issue for that.
Test results, if applicable
A simple test case is:
which produces