PEtab-GUI provides a graphical user interface to inspect and edit parameter estimation problems encoded in the PEtab format.
To install PEtab-GUI from PyPI, run:
pip install petab_guior, to install PEtab-GUI in a dedicated virtual environment using pipx (to be installed separately), run:
pipx install petab_guiTo install the latest development version from GitHub, run:
pip install git+https://github.com/PEtab-dev/PEtab-GUI/-
Clone the repository:
git clone https://github.com/PEtab-dev/PEtab-GUI.git
-
Install the package from the root of the working tree:
pip install .
After installation, launch PEtab-GUI from the command line using the
petab_gui command.
Optionally, you can provide the path to an existing PEtab YAML file as an argument.
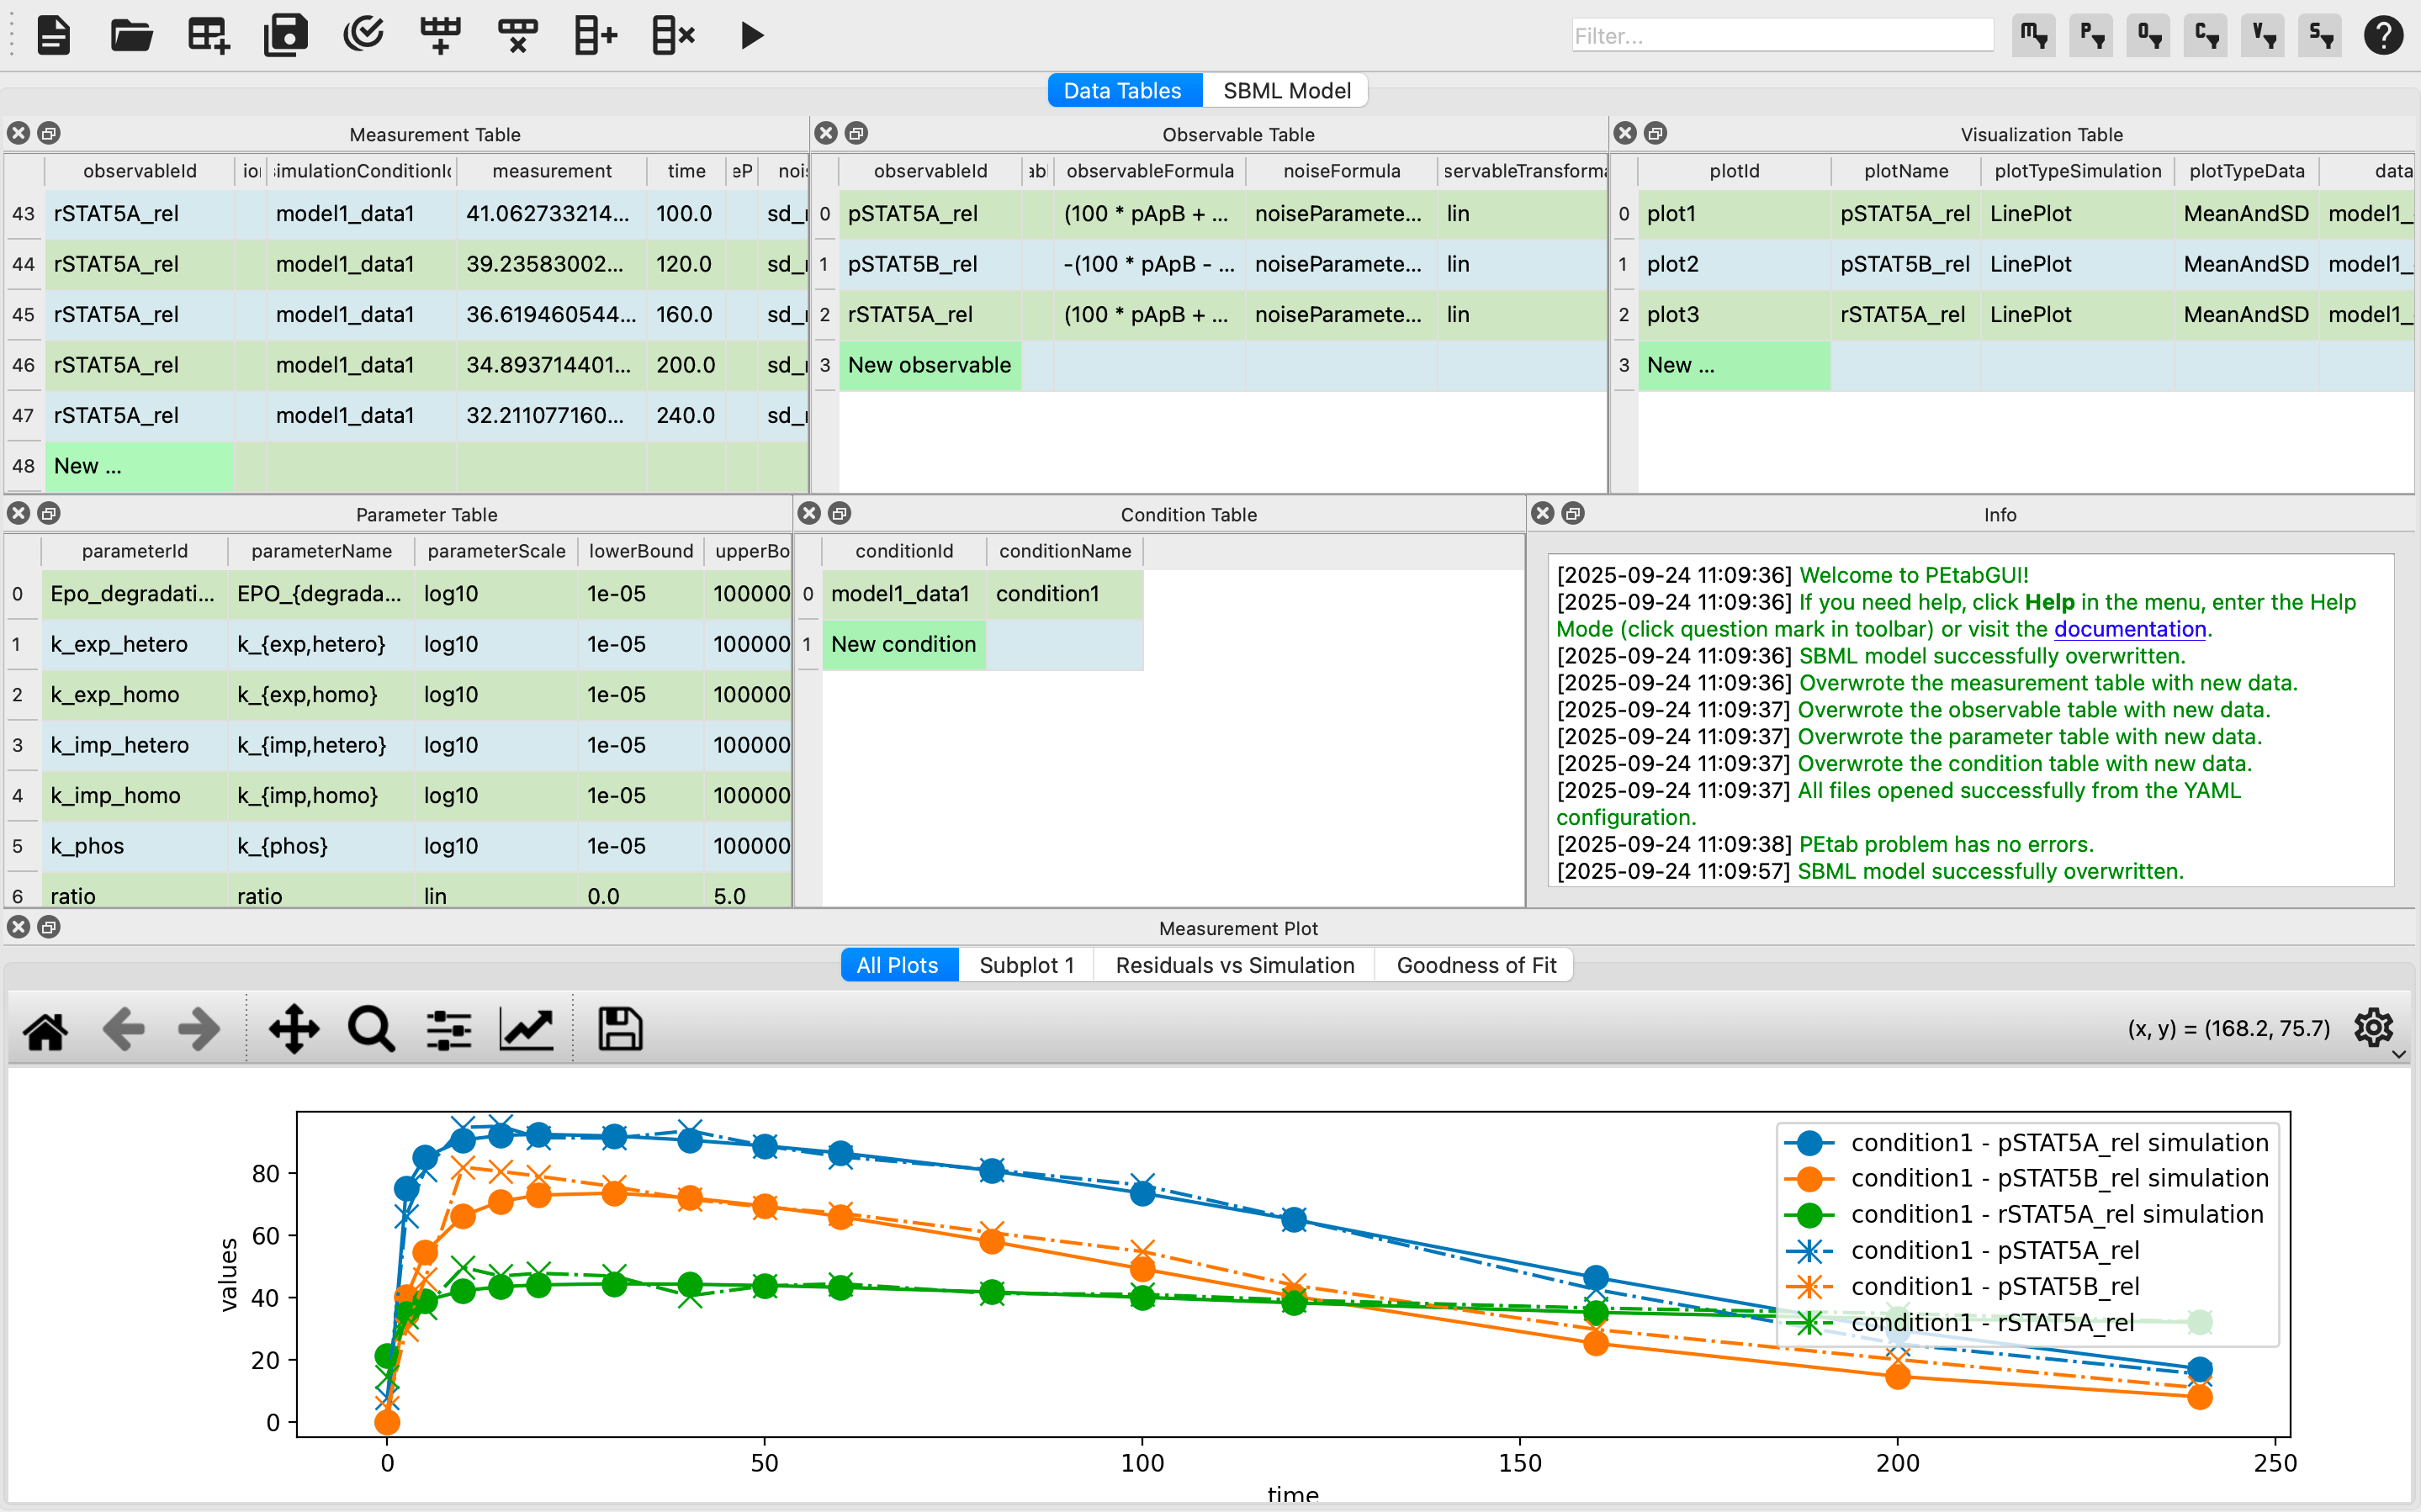
After loading a PEtab problem, PEtab-GUI will look something like this:
A set of real-world PEtab problems is available in the PEtab benchmark collection.
Download and unpack the archive,
then open one of the YAML files inside Benchmark-Models/*/ using
PEtab-GUI.
Benchmark-Models/Boehm_JProteomeRes2014/Boehm_JProteomeRes2014.yaml
should serve as a good starting point.
The PEtab-GUI provides a Python-based graphical user interface that simplifies the creation, editing, and validation of PEtab parameter estimation problems.
- Unified Environment
- Integrates all PEtab components (SBML models, conditions, observables, measurements, parameters, and visualization files).
- Supports drag-and-drop import of YAML or individual component files.
- Automatically resolves mismatches and converts matrix-format experimental data into valid PEtab format.
- Interactive and Intuitive Editing
- Dockable, resizable, and movable table widgets for each PEtab file.
- Context-aware editing with combo-boxes, drop-downs, and multi-cell editing.
- Automatic generation of missing observables/conditions with customizable defaults.
- Real-time validation and plausibility checks with PEtab linting tools.
- SBML view in both XML and human-readable Antimony syntax.
- Visualization and Simulation
- Interactive plots linking measurement data with model simulations.
- Bidirectional highlighting between plots and tables.
- Built-in simulation via BasiCO with one-click parameter testing.
- Intelligent defaults for visualization with optional user customization.
- Ability to disable plotting for large models to maintain responsiveness.
- Archiving and Export
- Export individual tables, the SBML model, or complete PEtab problems.
- Save as directory structures or COMBINE archives for reproducibility