

Gicisky BLE Label Home Assistant Integration
| Size | Example |
|---|---|
| 2.1" (250x128) |  |
| 2.9" (296x128) |  |
| 10.2" (960x640) | 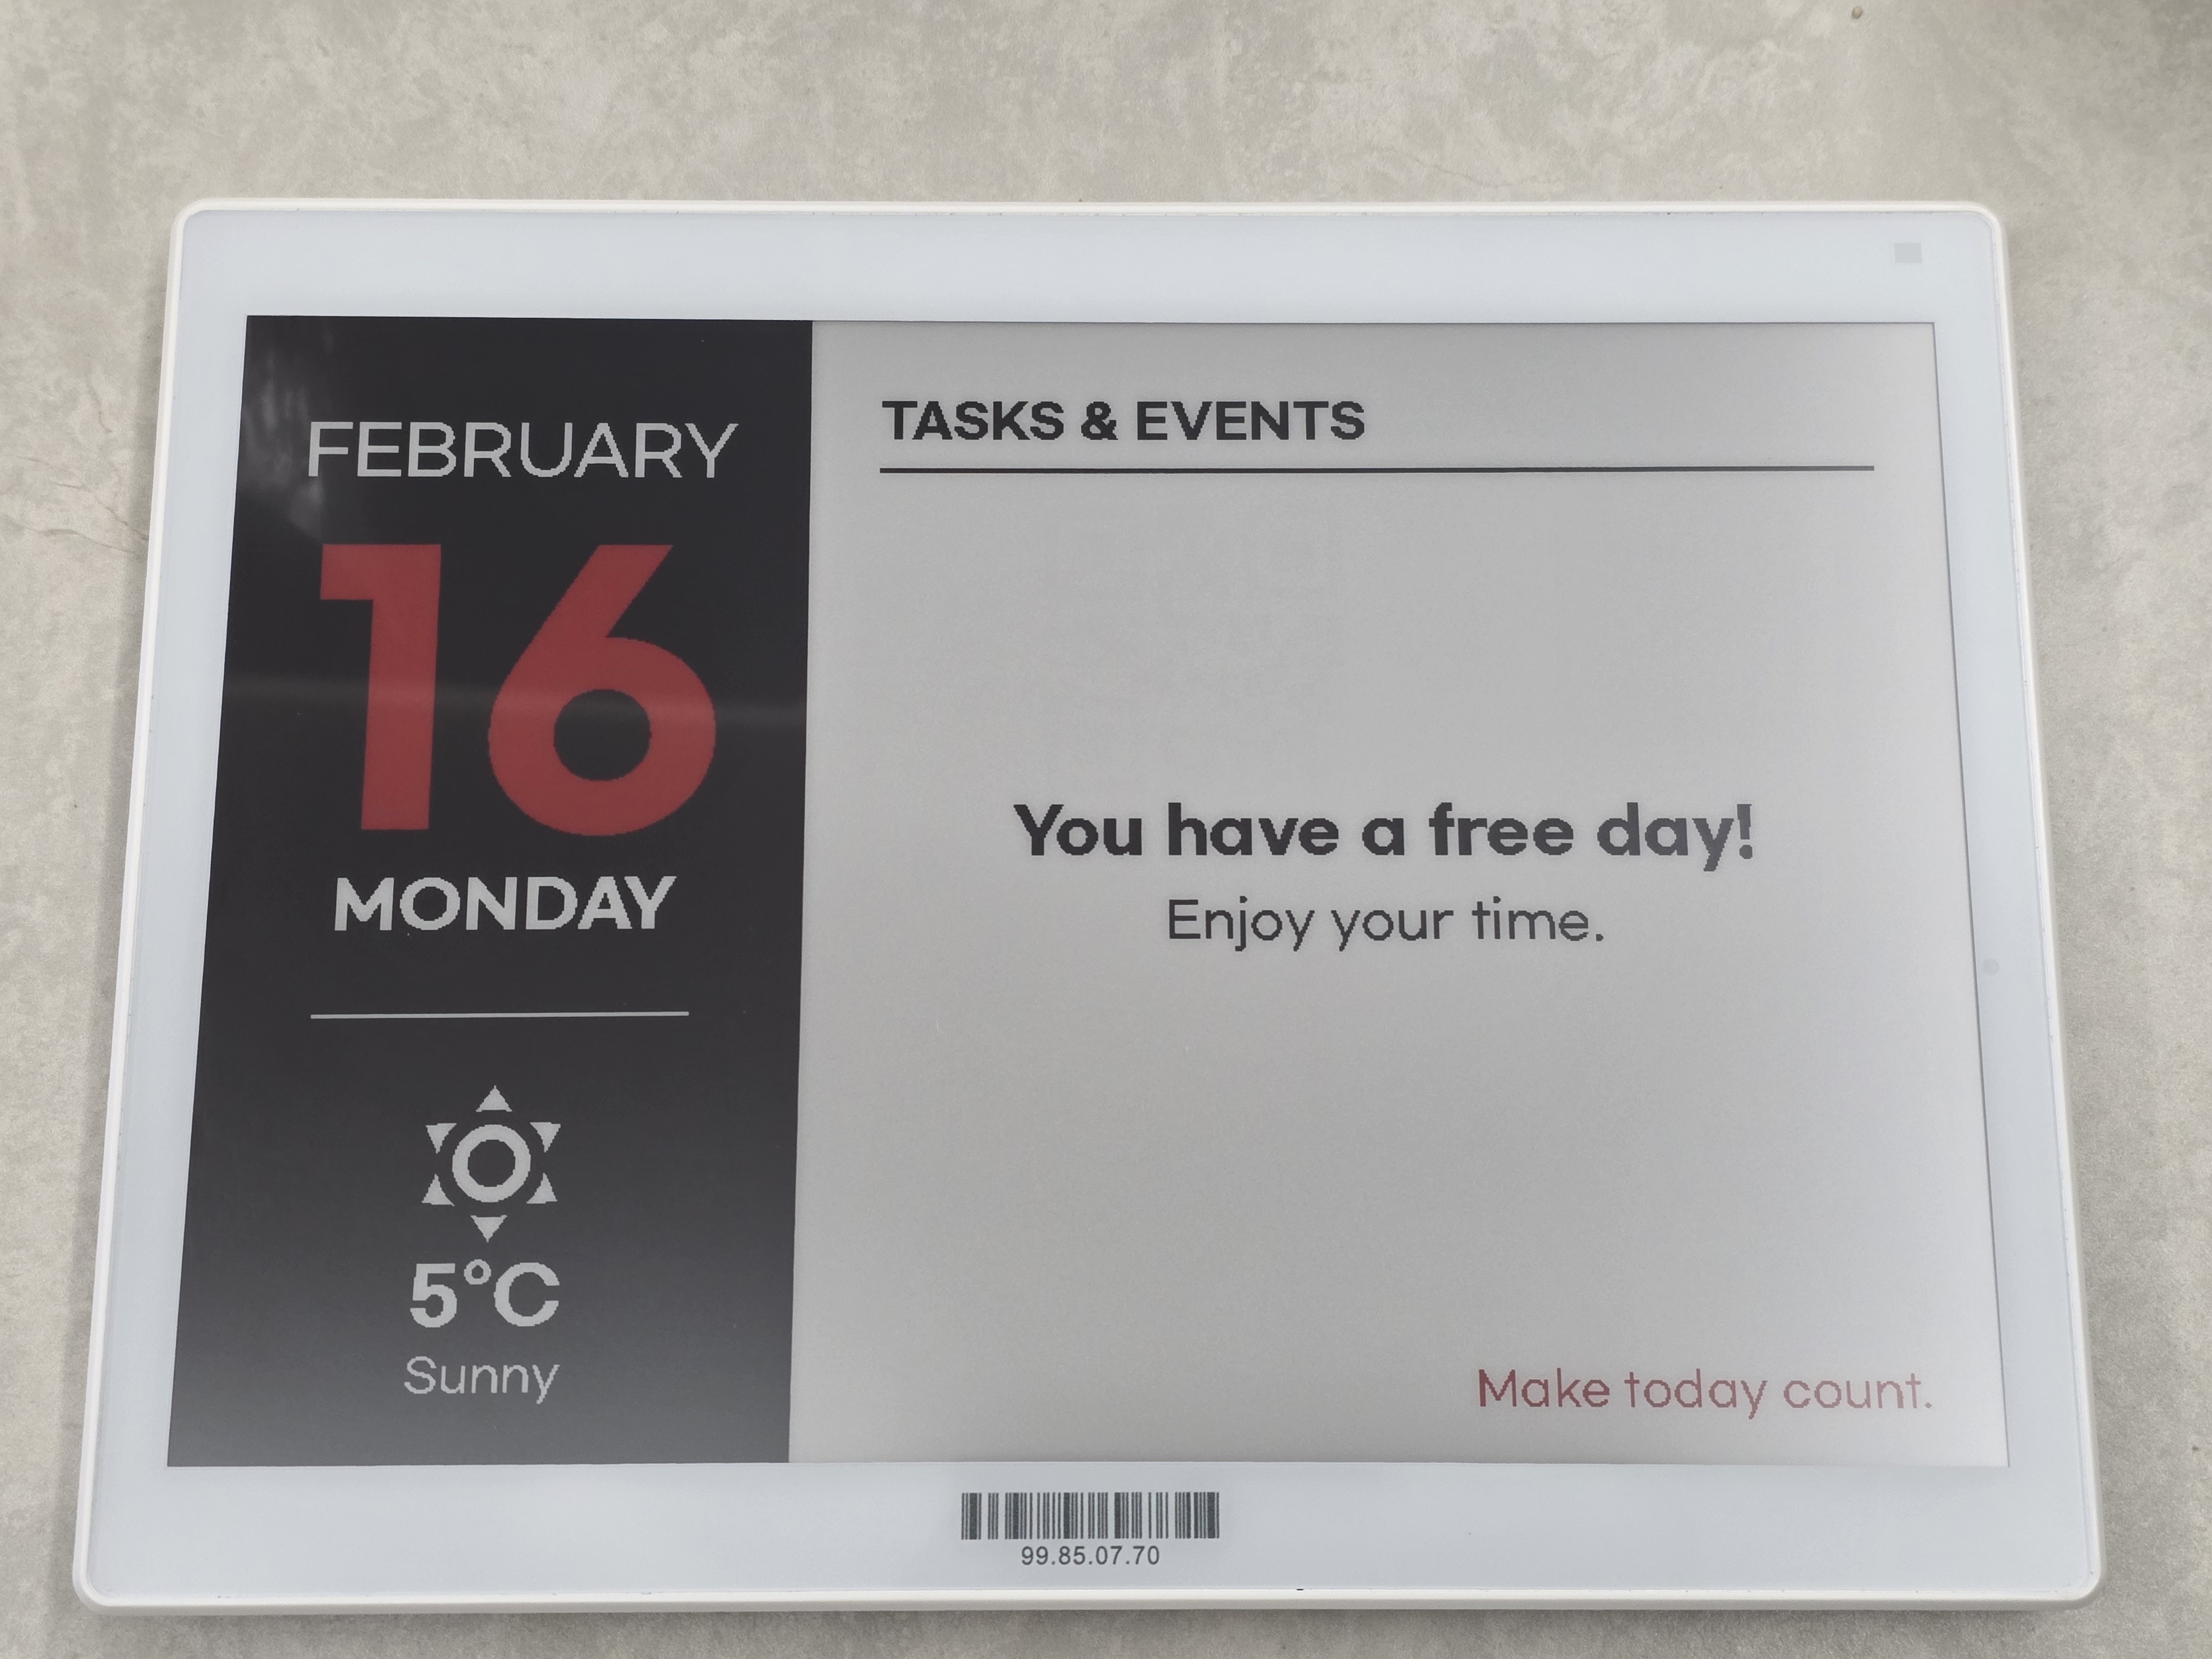 |
An Electronic Label (also known as an Electronic Shelf Label, ESL) is a small display device that uses
electronic paper (e-paper) instead of traditional paper.
Once content is displayed, it remains visible without consuming power,
making electronic labels extremely energy-efficient and well suited for always-on information display.
This project uses electronic labels manufactured by Gicisky.
- 📄 E-paper display
- Paper-like appearance with excellent readability
- 🔋 Ultra-low power consumption
- Power is only used when the display is updated
- 📡 Wireless communication
- Display content can be updated remotely
- 📐 Compact and lightweight
- Easy to mount on walls, shelves, doors, or devices
Although electronic labels are commonly associated with retail price tags,
their core value lies in being small, persistent, and power-efficient displays.
Electronic labels are ideal for displaying information that:
- Needs to be visible at all times
- Does not change frequently
- Must be shown in locations where continuous power is impractical
This project focuses on these fundamental characteristics and explores electronic labels
beyond their traditional use cases.
🐞 Found a bug? Let us know via an Issue.
💡 Have a question or suggestion? Join the Discussion!
| Type | Size | Resolution | Colors |
|---|---|---|---|
| TFT | 2.1" | 250 × 132 | BW |
| EPD | 2.1" | 250 × 128 | BWR |
| EPD | 2.9" | 296 × 128 | BW |
| EPD | 2.9" | 296 × 128 | BWR |
| EPD | 2.9" | 296 × 128 | BWRY |
| EPD | 3.7" | 240 × 416 | BWR |
| EPD | 4.2" | 400 × 300 | BWR |
| EPD | 7.5" | 800 × 480 | BWR |
| EPD | 10.2" | 960 × 640 | BWR |
-
In my country, I can purchase from the official site linked below, but I am not sure if it is available for purchase in all countries.
- Install this integration with HACS (adding repository required), or copy the contents of this
repository into the
custom_components/giciskydirectory. - Restart Home Assistant.
- It is strongly recommended to use a Bluetooth proxy instead of a built-in Bluetooth adapter.
Bluetooth proxies generally offer more stable connections and better range, especially in environments with multiple BLE devices.
Tip
For hardware recommendations, refer to Great ESP32 Board for an ESPHome Bluetooth Proxy.
-
When using a Bluetooth proxy, it is strongly recommended to keep the scan interval at its default value.
Changing these values may cause issues with Bluetooth data transmission. -
bluetooth_proxy: must always have active: true.
Example (recommended configuration with default values):
esp32_ble_tracker:
  scan_parameters:
    active: true

bluetooth_proxy:
  active: true
After adding a device, you can configure the following options via Settings > Devices & Services > Gicisky > Configure:
| Option | Default | Range | Description |
|---|---|---|---|
| Retry Count | 3 | 1–10 | Number of retry attempts when BLE write fails |
| Write Delay (ms) | 0 | 0–1000 | Delay in milliseconds between each BLE write operation |
| Prevent Duplicate Send | false | true/false | If enabled, prevents sending the same image data consecutively to save battery and reduce traffic |
Tip
If you experience frequent write failures, try increasing the Retry Count.
If writes are unstable, try setting Write Delay to 50–100 ms to give the device more time to process each packet.
| Parameter | Required | Default | Description |
|---|---|---|---|
payload |
✅ | — | List of drawing elements (see Payload Element Types) |
rotate |
❌ | 0 |
Image rotation: 0, 90, 180, 270 |
background |
❌ | white |
Background color: white, black, red |
threshold |
❌ | 128 |
Black binary threshold (0–255) |
red_threshold |
❌ | 128 |
Red binary threshold (0–255) |
dry_run |
❌ | false |
Generate preview image without sending to device |
action: gicisky.write
data:
  payload:
    - type: text
      value: Hello World!
      x: 10
      y: 10
      size: 40
target:
device_id: <your device>action: gicisky.write
data:
rotate: 90
background: black
payload:
- type: text
value: Rotated!
x: 10
y: 10
size: 30
color: white
target:
device_id: <your device>Preview image is available via the Camera entity without sending data to the physical device.
Tip
You can use the Gicisky Payload Editor to design a rough layout via drag-and-drop in your browser and automatically generate YAML. Use the generated YAML with dry_run: true to preview it without sending data to the actual device.
action: gicisky.write
data:
  dry_run: true
  payload:
    - type: text
      value: Preview Test
      x: 10
      y: 10
      size: 30
target:
device_id: <your device>Tip
All elements support the visible field (true/false) to conditionally show or hide them.
Note
Color values: This is an e-ink display that only supports 4 colors: white, black, red, yellow.
HEX strings (#RRGGBB) are accepted as a convenience but will be automatically mapped to the nearest supported color.
- type: text
  value: "Hello World!"
  x: 10
  y: 10
  size: 40
  font: "fonts/NotoSansKR-Bold.ttf"
  color: black
  anchor: lt            # Pillow anchor (e.g. lt, mt, rt, lm, mm, rm)
  align: left           # left, center, right
  spacing: 5
  stroke_width: 1
  stroke_fill: white
  max_width: 200        # Auto-wrap text within this pixel width
  rotation: 45          # Rotate text by angle (degrees counter-clockwise)
  background: "#CCCCCC" # Optional background color behind text
  background_padding: 3 # Padding around background (default: 2)
If y is omitted the element stacks below the previous element automatically (y_padding controls the gap, default 10).
- type: multiline
  value: "Line1;Line2;Line3"
  delimiter: ";"
  x: 10
  start_y: 10           # Starting Y position (auto-stacks if omitted)
  offset_y: 25           # Y spacing between lines (required)
  size: 20
  font: "fonts/NotoSansKR-Regular.ttf"
  color: black
  anchor: lm
  stroke_width: 0
stroke_fill: white- type: line
x_start: 0
x_end: 250
y_start: 64
y_end: 64
fill: black
width: 2
dash: [10, 5] # Optional: [on_px, off_px] for dashed/dotted linesIf y_start is omitted the line is drawn at the current auto-stack Y position (y_padding offset).
- type: rectangle
  x_start: 5
  y_start: 5
  x_end: 100
  y_end: 60
  fill: red
  outline: black
  width: 2
  radius: 10            # Corner radius for rounded rectangle
corners: "top_left,top_right" # all / top_left / top_right / bottom_right / bottom_left- type: rectangle_pattern
x_start: 10
y_start: 10
x_size: 20
y_size: 20
x_repeat: 5
y_repeat: 3
x_offset: 5
y_offset: 5
fill: black
outline: black
width: 1
radius: 5
corners: "all"- type: circle
x: 125 # Center X
y: 64 # Center Y
radius: 30
fill: red
outline: black
width: 2- type: ellipse
x_start: 50
y_start: 20
x_end: 200
y_end: 100
fill: red
outline: black
width: 1Uses Material Design Icons. You can use the icon name with or without the mdi: prefix.
- type: icon
  value: "weather-sunny"     # or "mdi:weather-sunny"
  x: 10
  y: 10
  size: 48
  color: black               # or use fill
  anchor: la
  stroke_width: 0
stroke_fill: whiteSupports HTTP/HTTPS URLs, local file paths, and Base64 data URIs.
mode |
Description |
|---|---|
stretch |
Stretch to fill exactly (default) |
fit / contain |
Scale preserving aspect ratio, pad with transparency |
fill |
Scale and crop to fill exactly, no padding |
- type: dlimg
  url: "https://example.com/image.png"
  x: 10
  y: 10
  xsize: 100
  ysize: 100
  rotate: 0
  mode: fit             # stretch / fit / fill / contain
# Local file
- type: dlimg
url: "/config/www/images/photo.png"
x: 0
y: 0
xsize: 250
ysize: 128# Base64 data URI
- type: dlimg
url: "data:image/png;base64,iVBORw0KGgo..."
x: 10
y: 10
xsize: 50
ysize: 50- type: qrcode
data: "https://www.home-assistant.io"
x: 140
y: 10
boxsize: 2
border: 1
color: black
bgcolor: white- type: barcode
data: "123456789012"
x: 10
y: 80
code: code128 # code128, ean13, ean8, upc, isbn13, etc.
color: black
bgcolor: white
module_width: 0.2
module_height: 7
quiet_zone: 6.5
font_size: 5
text_distance: 5.0
write_text: true- type: diagram
x: 0
y: 0
width: 250
height: 128
margin: 20
font: "fonts/NotoSansKR-Regular.ttf"
bars:
values: "Mon,10;Tue,25;Wed,15;Thu,30;Fri,20"
color: black
margin: 10
legend_size: 10
legend_color: blackReads entity history from Home Assistant Recorder.
- type: plot
  data:
    - entity: sensor.temperature
      color: black
      width: 2
      area_fill: "#CCCCCC"  # Optional: fill area under the line
  duration: 86400          # Seconds (default: 86400 = 1 day)
  x_start: 30
  y_start: 10
  x_end: 290
  y_end: 120
  size: 10
  font: "fonts/NotoSansKR-Regular.ttf"
  low: 15                  # Fixed Y-axis minimum
  high: 35                 # Fixed Y-axis maximum
  ylegend:
    width: -1              # Auto-calculate
    color: black
    position: left         # left or right
  yaxis:
    width: 1
    color: black
    tick_width: 2
    tick_every: 5
    grid: 5
    grid_color: black
  xlegend:                 # Optional: time labels on X-axis
    ticks: 3               # Number of labels (default: 3)
    format: "%H:%M"        # strftime format (default: "%H:%M")
    color: black
    size: 9
debug: false- type: progress_bar
x_start: 10
y_start: 100
x_end: 240
y_end: 120
progress: 75
direction: right # right, left, up, down
background: white
fill: red
outline: black
width: 1
radius: 8 # Optional: rounded corners radius
show_percentage: true- type: arc
x_start: 10
y_start: 10
x_end: 110
y_end: 110
start_angle: 0
end_angle: 270
outline: black
width: 3
pie: false # true = pieslice (filled wedge), false = arc only
fill: "#CCCCCC" # Only used when pie: true- type: gauge
x: 120 # Center X
y: 80 # Center Y
radius: 60
progress: 72 # Current value (mapped between min_value and max_value)
min_value: 0
max_value: 100
fill: black # Progress arc color
background: white # Track (background arc) color
outline: black
width: 8 # Arc bar thickness
show_value: true # Display numeric value at center
font: "fonts/NotoSansKR-Regular.ttf"
size: 18
color: black- type: polygon
points: "10,100;60,10;110,100" # Semicolon-separated x,y pairs
fill: black
outline: black
width: 1- type: table
x: 10
y: 50
columns: [80, 120, 80] # Column widths in pixels
rows:
- ["TIME", "EVENT", "PLACE"] # First row treated as header if header: true
- ["09:00", "Meeting", "3F"]
- ["14:00", "Lunch", "B1"]
header: true # First row is a header (default: true)
header_fill: black
header_color: white
cell_color: black
cell_fill: null # Optional background for data rows
border_color: black
border_width: 1
row_height: 22
padding: 4
font: "fonts/NotoSansKR-Regular.ttf"
font_size: 14
align: left # left / center / right- type: text_box
value: "ON"
x: 10
y: 10
size: 18
font: "fonts/NotoSansKR-Regular.ttf"
padding: 6 # Padding around text
fill: black # Box background color
color: white # Text color
outline: black # Box border color
width: 1 # Border width
radius: 6 # Corner radius- type: datamatrix
data: "https://home-assistant.io"
x: 10
y: 10
boxsize: 2 # Pixel size of each cell (default: 2)
color: black
bgcolor: whiteaction: gicisky.write
data:
rotate: 0
background: white
payload:
- type: text
value: "Home Status"
x: 10
y: 5
size: 24
font: "fonts/NotoSansKR-Bold.ttf"
- type: line
x_start: 0
x_end: 250
y_start: 35
y_end: 35
fill: black
width: 1
- type: icon
value: thermometer
x: 10
y: 45
size: 24
color: black
- type: text
value: "{{ states('sensor.temperature') }}°C"
x: 40
y: 48
size: 20
- type: progress_bar
x_start: 10
y_start: 80
x_end: 240
y_end: 95
progress: "{{ states('sensor.humidity') | int }}"
direction: right
fill: black
show_percentage: true
- type: qrcode
data: "https://www.home-assistant.io"
x: 180
y: 40
boxsize: 2
border: 1
target:
device_id: <your device>Tip
All elements support the visible field (true/false, default: true) to conditionally show or hide them.
| Type | Required Fields | Optional Fields | Description |
|---|---|---|---|
| text | x, value |
y, size(20), font, color(black), anchor(lt), align(left), spacing(5), stroke_width(0), stroke_fill(white), max_width, y_padding(10), rotation(0), background, background_padding(2) |
Draws text. Supports rotation and background fill. Auto-stacks if y omitted. |
| multiline | x, value, delimiter, offset_y |
start_y, size(20), font, color(black), anchor(lm), stroke_width(0), stroke_fill(white), y_padding(10) |
Splits text by delimiter and draws each line with offset_y spacing. |
| line | x_start, x_end |
y_start, y_end, fill(black), width(1), y_padding(0), dash([on,off]) |
Draws a straight line. dash for dashed/dotted style. Auto-stacks if y_start omitted. |
| rectangle | x_start, x_end, y_start, y_end |
fill, outline(black), width(1), radius(0), corners(all) |
Draws a rectangle with optional rounded corners. |
| rectangle_pattern | x_start, y_start, x_size, y_size, x_repeat, y_repeat, x_offset, y_offset |
fill, outline(black), width(1), radius(0), corners(all) |
Repeated grid of rectangles (pattern/tiling). |
| circle | x, y, radius |
fill, outline(black), width(1) |
Draws a circle at center (x, y). |
| ellipse | x_start, x_end, y_start, y_end |
fill, outline(black), width(1) |
Draws an ellipse inside a bounding box. |
| arc | x_start, y_start, x_end, y_end, start_angle, end_angle |
fill, outline(black), width(1), pie(false) |
Draws an arc or filled pieslice. pie: true for filled wedge. |
| gauge | x, y, radius, progress |
min_value(0), max_value(100), fill(black), background(white), outline(black), width(8), show_value(false), font, size(16), color(black) |
Circular gauge (270° sweep). Shows progress as arc. |
| polygon | points |
fill, outline(black), width(1) |
Draws a polygon. points: "x1,y1;x2,y2;..." format. |
| table | x, y, columns, rows |
header(true), header_fill(black), header_color(white), cell_color(black), cell_fill, border_color(black), border_width(1), row_height, padding(4), font, font_size(14), align(left) |
Draws a bordered table with optional header row. |
| text_box | x, y, value |
size(20), font, padding(5), fill(black), color(white), outline, width(1), radius(5) |
Draws text inside a rounded, filled background box. |
| icon | x, y, value, size |
color/fill(black), anchor(la), stroke_width(0), stroke_fill(white) |
Draws Material Design Icons. Supports mdi: prefix. MDI metadata is cached. |
| dlimg | x, y, url, xsize, ysize |
rotate(0), mode(stretch) |
Loads image from URL, local path, or Base64. mode: stretch/fit/fill/contain. |
| qrcode | x, y, data |
color(black), bgcolor(white), border(1), boxsize(2) |
Generates and embeds a QR code. |
| barcode | x, y, data |
color(black), bgcolor(white), code(code128), module_width(0.2), module_height(7), quiet_zone(6.5), font_size(5), text_distance(5.0), write_text(true) |
Draws various barcode formats. |
| datamatrix | x, y, data |
color(black), bgcolor(white), boxsize(2) |
Generates a DataMatrix 2D barcode. Requires pyStrich. |
| diagram | x, y, height |
width(canvas), margin(20), font, bars |
Creates a bar chart. bars object: values(required, "name,val;...") color(required), margin(10), legend_size(10), legend_color(black). |
| plot | data([{entity}]) |
duration(86400), x_start(0), y_start(0), x_end, y_end, size(10), font, low, high, ylegend, yaxis, xlegend, debug(false) |
Time-series graph from HA Recorder. Per-series: entity(required), color(black), width(1), joint, area_fill. |
| progress_bar | x_start, x_end, y_start, y_end, progress |
direction(right), background(white), fill(red), outline(black), width(1), radius(0), show_percentage(false) |
Draws a progress bar. direction: right/left/up/down. radius for rounded corners. |
| Sub-Object | Field | Default | Description |
|---|---|---|---|
| ylegend | width |
-1 (auto) |
Legend width in pixels |
color |
black |
Legend text color | |
position |
left |
left or right |
|
font |
(inherits) | Legend font file | |
size |
(inherits) | Legend font size | |
| yaxis | width |
1 |
Axis line width |
color |
black |
Axis color | |
tick_width |
2 |
Tick mark width | |
tick_every |
1 |
Tick interval (value unit) | |
grid |
5 |
Grid dot spacing (pixels) | |
grid_color |
black |
Grid color | |
| xlegend | ticks |
3 |
Number of time labels |
format |
"%H:%M" |
strftime format string | |
color |
black |
Label text color | |
size |
(inherits) | Label font size | |
font |
(inherits) | Label font file | |
| data item | area_fill |
null |
Fill color for area under the line |
The text, multiline, diagram, and plot elements accept a font field.
The default font is fonts/NotoSansKR-Regular.ttf.
| Family | Weights |
|---|---|
| CookieRun | fonts/CookieRunRegular.ttf, fonts/CookieRunBold.ttf, fonts/CookieRunBlack.ttf |
| Gmarket Sans | fonts/GmarketSansTTFLight.ttf, fonts/GmarketSansTTFMedium.ttf, fonts/GmarketSansTTFBold.ttf |
| Noto Sans KR | fonts/NotoSansKR-Thin.ttf, fonts/NotoSansKR-ExtraLight.ttf, fonts/NotoSansKR-Light.ttf, fonts/NotoSansKR-Regular.ttf, fonts/NotoSansKR-Medium.ttf, fonts/NotoSansKR-SemiBold.ttf, fonts/NotoSansKR-Bold.ttf, fonts/NotoSansKR-ExtraBold.ttf, fonts/NotoSansKR-Black.ttf |
| OwnglyphParkDaHyun | fonts/OwnglyphParkDaHyun.ttf |
You can also use your own .ttf font files by placing them in your Home Assistant www/fonts directory:
/config/www/fonts/MyCustomFont.ttf
Then reference them by filename only:
- type: text
  value: "Custom Font"
  x: 10
  y: 10
  size: 30
  font: "MyCustomFont.ttf"
Note
The integration first looks for fonts in its own fonts/ directory, then falls back to www/fonts/ in your Home Assistant config.
| Size | Example | Preview | Yaml |
|---|---|---|---|
| 2.1" (250×128) | Date |  |
2.1" Date |
| 2.1" (250×128) | Naver Weather |  |
2.1" Naver Weather |
| 2.1" (250×128) | Waste Collection | 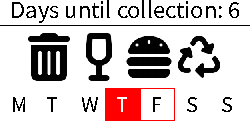 |
2.1" Waste Collection |
| 2.1" (250×128) | Wifi | 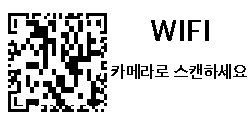 |
2.1" Wifi |
| 2.1" (250×128) | TMap time | 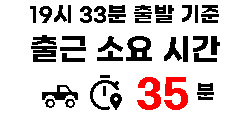 |
2.1" TMap time |
| 2.9" (296×128) | Google Calendar |  |
2.9" Google Calendar |
| 2.9" (296×128) | Presence Display | 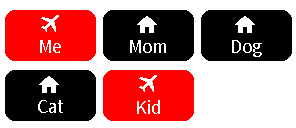 |
2.9" Presence Display |
| 4.2" (400×300) | Image | 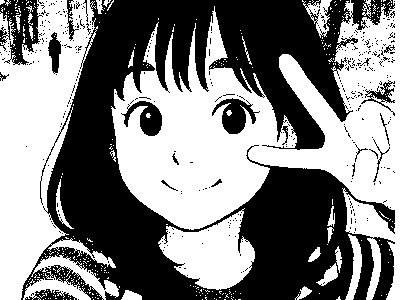 |
4.2" Image |
| 4.2" (400×300) | Naver Weather | 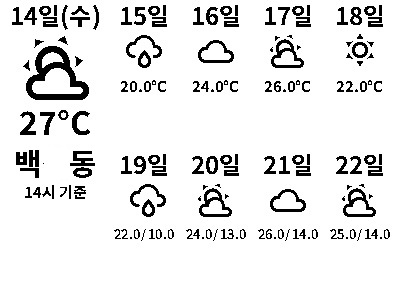 |
4.2" Naver Weather |
| 4.2" (400×300) | Date Weather | 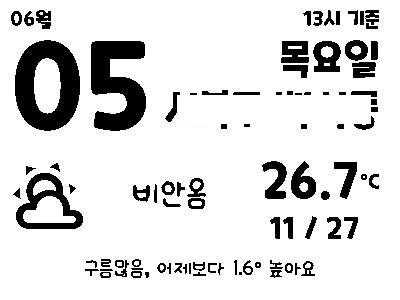 |
4.2" Date Weather |
| 4.2" (400×300) | Weather News | 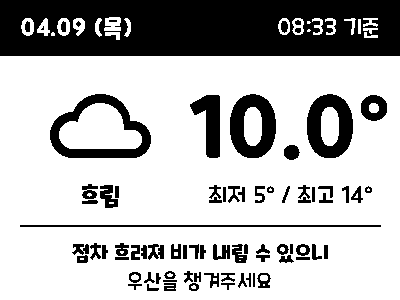 |
4.2" Weather News |
| 4.2" (400×300) | 3D Print | 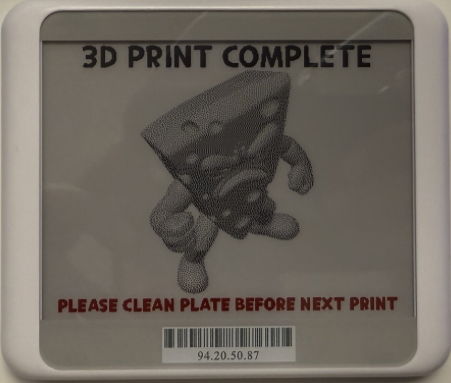 |
4.2" 3D Print |
| 7.5" (800×480) | Google Calendar | 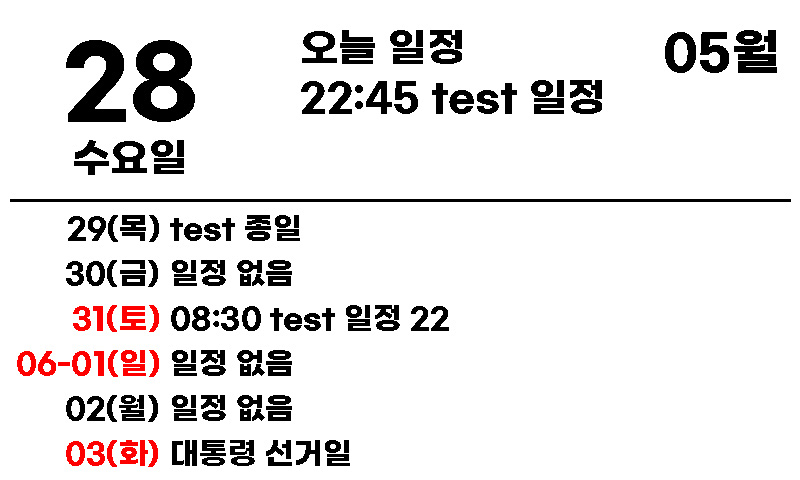 |
7.5" Google Calendar |
| 7.5" (800×480) | Date Weather | 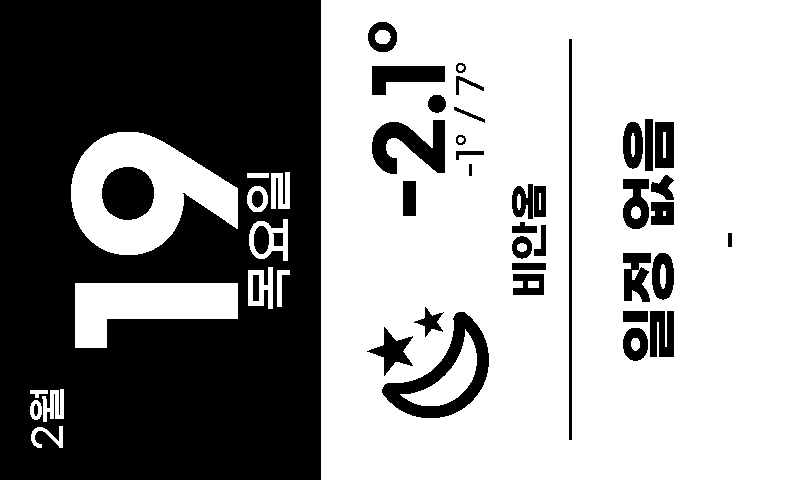 |
7.5" Date Weather |
| 10.2" (960×640) | Calendar Weather | 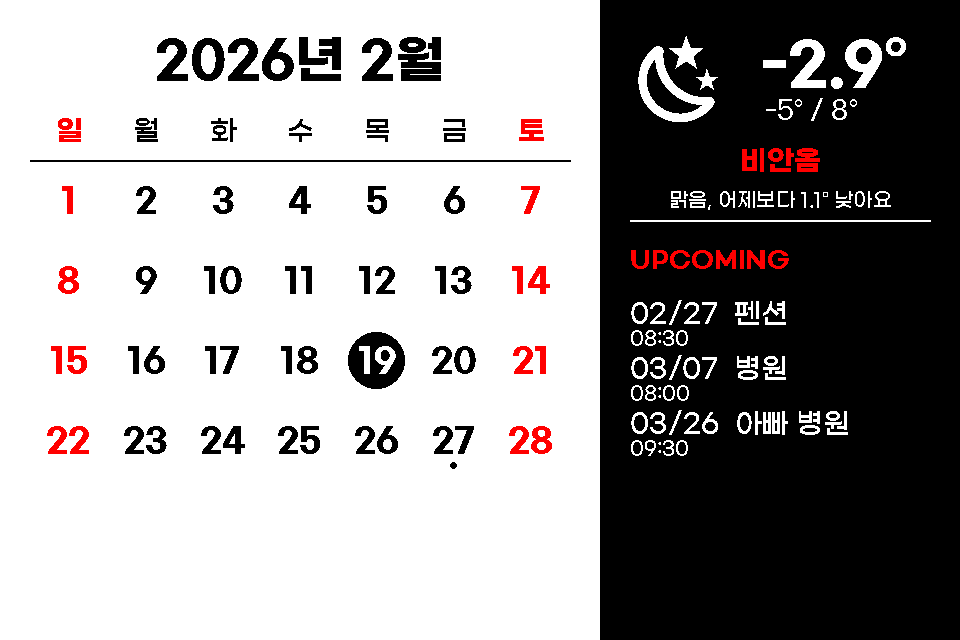 |
10.2" Calendar Weather |
| 10.2" (960×640) | Calendar | 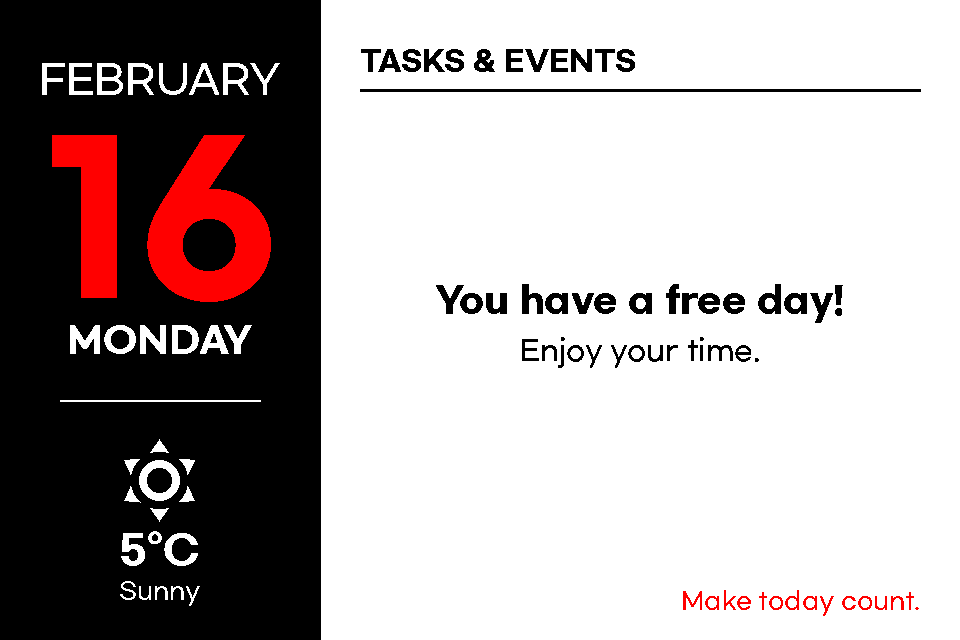 |
10.2" Calendar |
# https://openapi.sk.com/products/detail?linkMenuSeq=46
rest_command:
  request_tmap_routes:
    url: https://apis.openapi.sk.com/tmap/routes?version=1
    method: POST
    headers:
      appKey: !secret tmap_api_key
      accept: "application/json, text/html"
    content_type: "application/json; charset=utf-8"
    payload: >-
      {
        "startX": {{ startX }},
        "startY": {{ startY }},
        "endX": {{ endX }},
        "endY": {{ endY }},
        "searchOption": {{ searchOption }},
        "totalValue": 2,
        "trafficInfo ": "Y",
        "mainRoadInfo": "Y",
}Remote Calendar -> Add google *.ics