This repo is made to display interactive graph of availability that depends on two parameters lambda and mu, but as well as plotly allows to create one slider - constaints will depend on parameters named as hour.
So lambda = 1-10/hours
mu = 1/hours
Here is an initial link to graph a link
- Fork that repository to make all necessary files available for deploying on heroku ( push that button
fork) / or you could download repo using


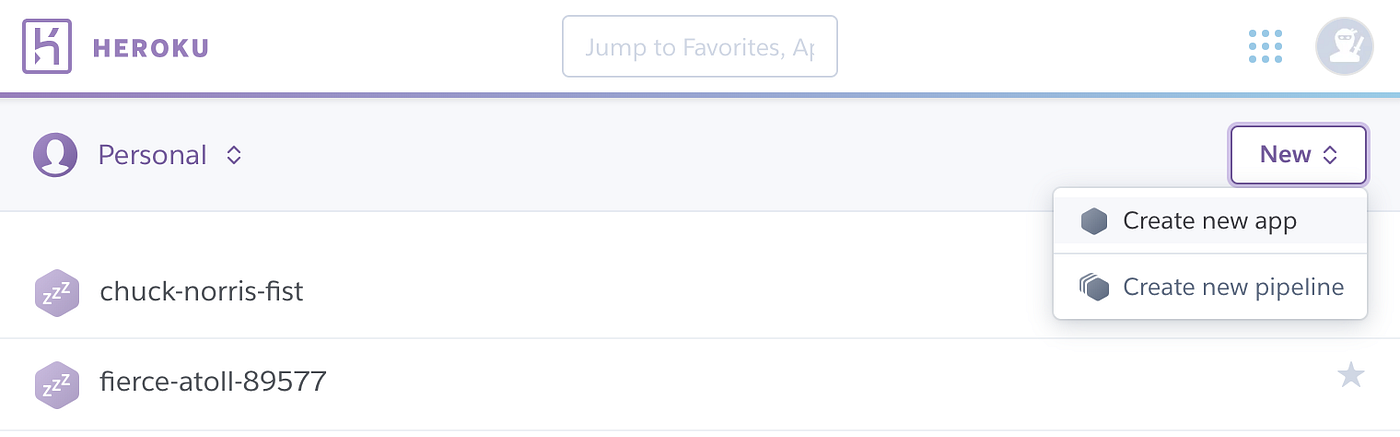
- Login to Heroku (or if you don't have an account - register) and create new app
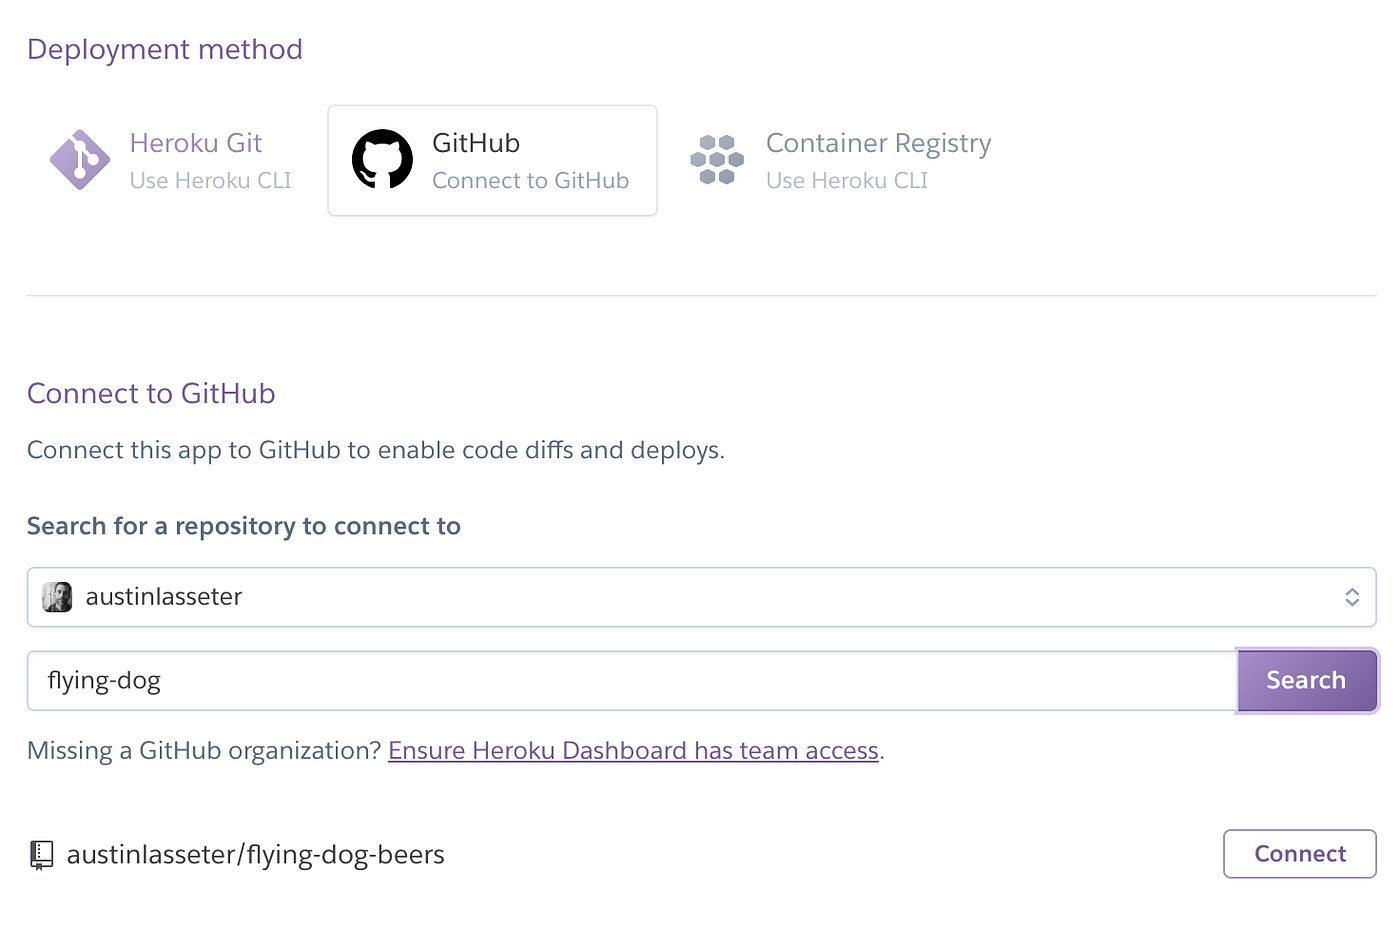
- Select
githubas your deployment method, and then search for your repo (note that it will appear under your name, not mine, since you already forked it!). Go ahead and pick “connect”.
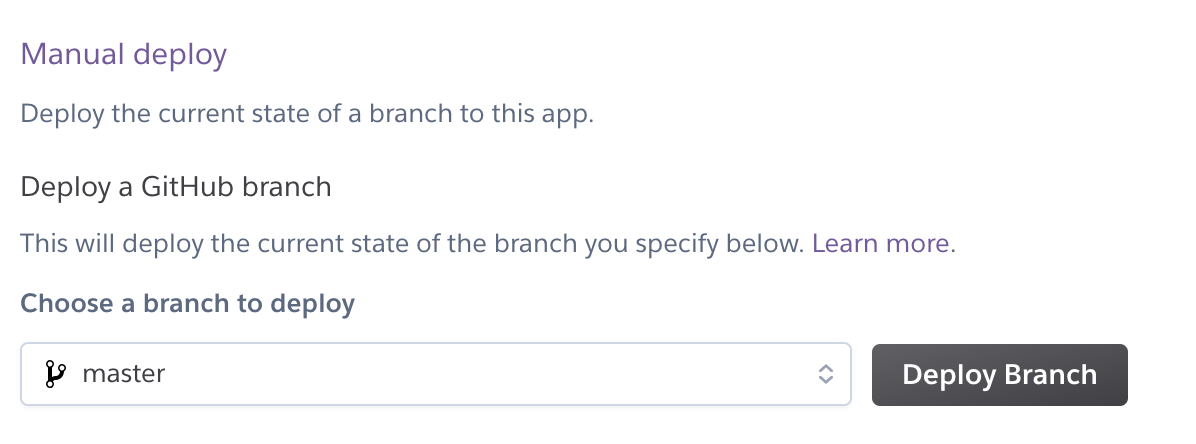
- There will be 2 option how to deploy branches : manual or authomatic. Authomatic deployment method will track all commit in branch and in case of files will be changed - deployment authomaticaly displays on app link. In case of manual deploy - every changes should be deployed manualy on the next option of heroku dashboard
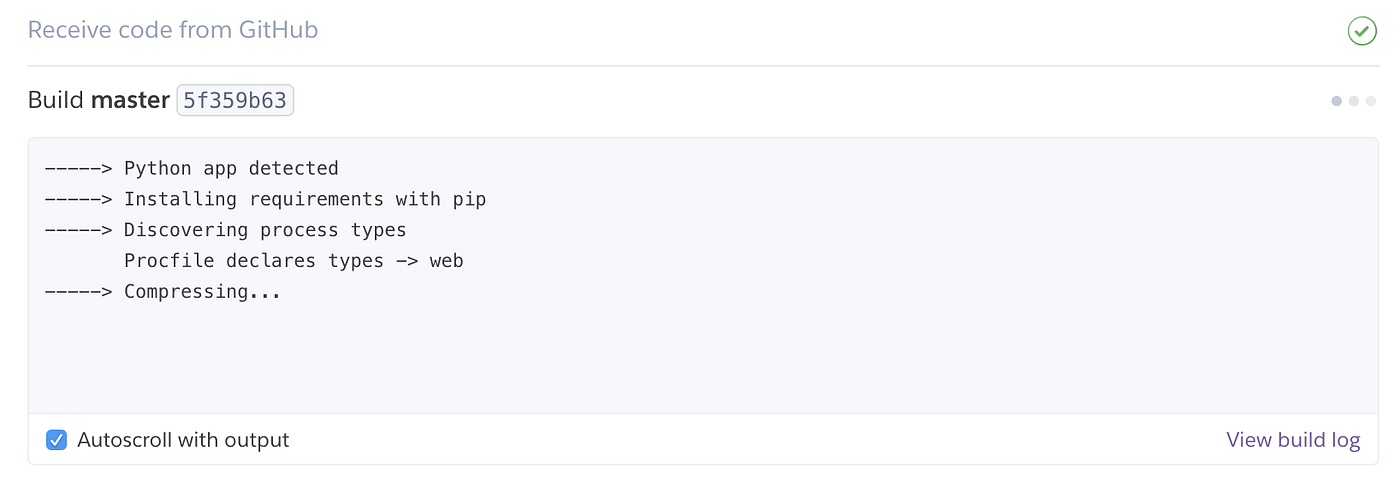
- Your app is ready for operation, in my case it is available on next link