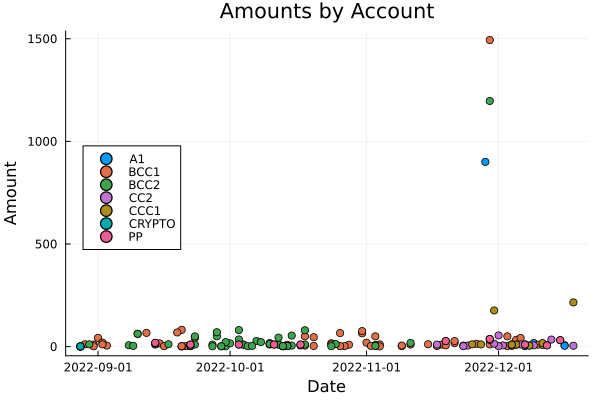
Mint.com already comes with great simple visualizations, but I was curious as to how I can visualize data using Julia. The pictures are below.
Data is gathered from the transactions_csv exported from Mint.com which is then preprocessed through a python code that's similar to the one in the pdf.
DataFrames.jl, Plots.jl, FreqTables.jl


https://github.com/JuliaPlots/Plots.jl
https://docs.juliaplots.org/latest/series_types/histogram/
https://stackoverflow.com/questions/38015840/dataframes-jl-number-of-rows