Balanced dataset is always the desired dataset for training machine learning models. However, one can never get data that is equally distributed samples among all classes in nature. Imbalanced classification is a crucial problem that data scientists have to deal with, since it leads ML models to have poor predictive performance, specifically for the minority classes. This report discusses a method, the re-weighted random sampler combined with data augmentation that improves convolutional neural networks’ performance on imbalanced datasets.
This report discusses the re-weighted random sampler combined with data augmentation’ effect on imbalanced classification. This method can be splitted into 2 parts. The first one is the re-weighted random sampler.
In imbalanced classification, since there are more samples in majority classes than minority classes, the ML(machine learning) model will learn more samples from the majority classes’ samples. Such bias results in high accuracy in majority classes but low accuracy in minority classes. Therefore, the target of the re-weighted sampler is to let the ML model learn the same number of samples from each class. In order to develop a formula that calculates the weights for each dataset, the details of each dataset need to be known.
The cifar_50 balanced and long tailed datasets with imbalanced ratio = {0.1, 0.02, 0.005} are used to test the performance of the proposed method [1]. The shapes of the long tailed cifar_50 datasets are shown in fig 1, fig.2 and fig.3. The CT scans of breast cancer dataset is used as a supplemental dataset [2].
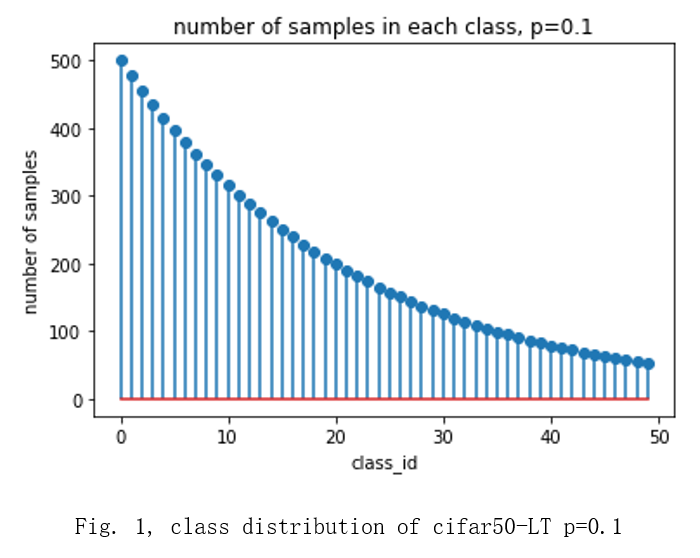
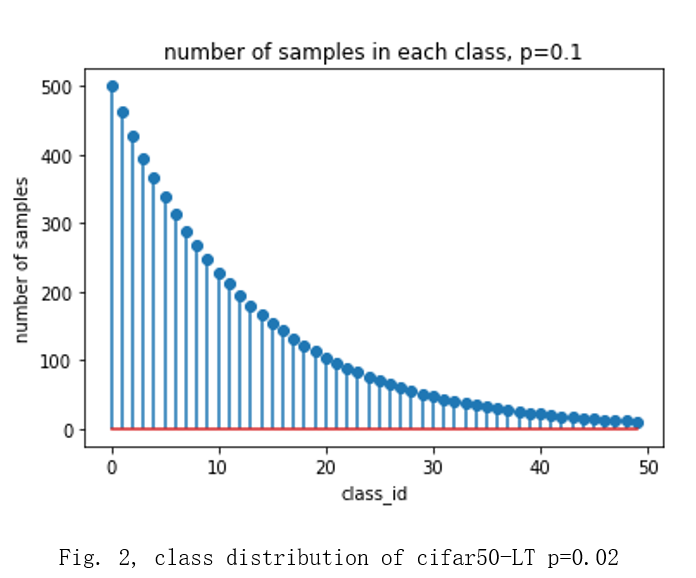
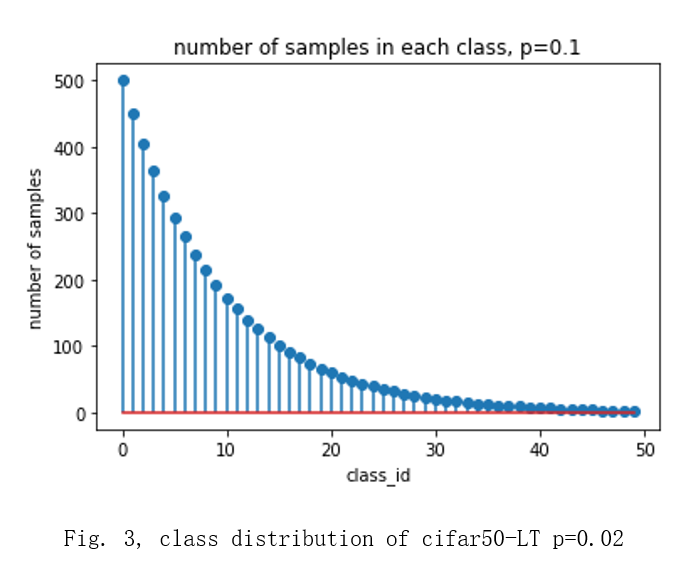
Long-tailed versions of CIFAR-50 are created by reducing the number of training samples per class according to an exponential function shown in Fig.4 [3].
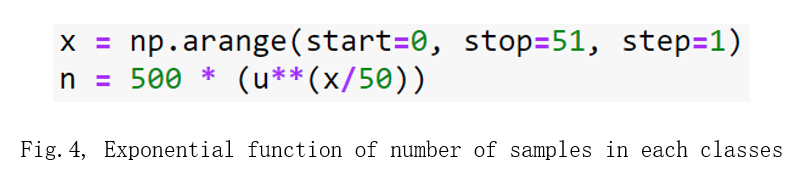
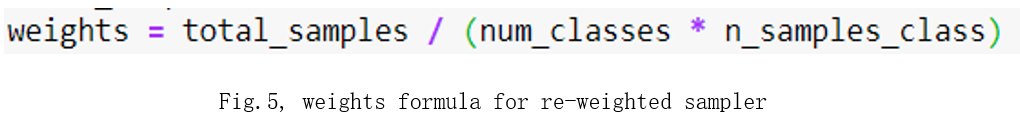
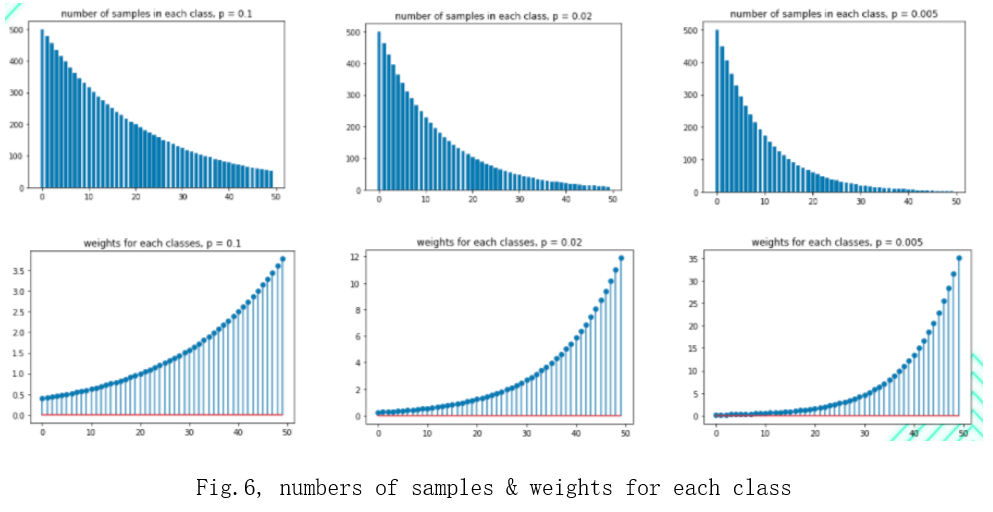
“n” is the number of samples, “u” is the imbalanced ratio = {0.1, 0.02, 0.005} and “x” is the class ID. To make the ML model learn the same number of samples from each class, class_weight x number of samples should be the same for each class. I developed a formula to calculate weights shown in Fig. 5. The calculated weights are shown in Fig. 6. The first row is the number of samples in each class, the second row is the weights and the columns are the different long-tailed datasets.
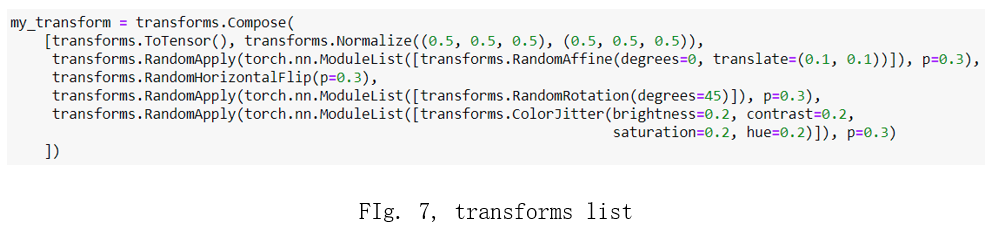
If re-weighted sampler is the only method implemented, the re-weighted sampler will make the model learn a few samples many times in tailed classes and thus the ML model will be overfitted on the few samples in the tailed classes. Therefore, data augmentation needs to be implemented to generate new samples [4]. The transform list is in Fig.7. Everytime the iterator takes a picture from the dataloader, the picture has 30% chance to be rotated, 30% chance to have affine transform, 30% chance to be flipped horizontally and 30% chance to be passed in a color jitter filter. These chances and transforms are not exclusive.
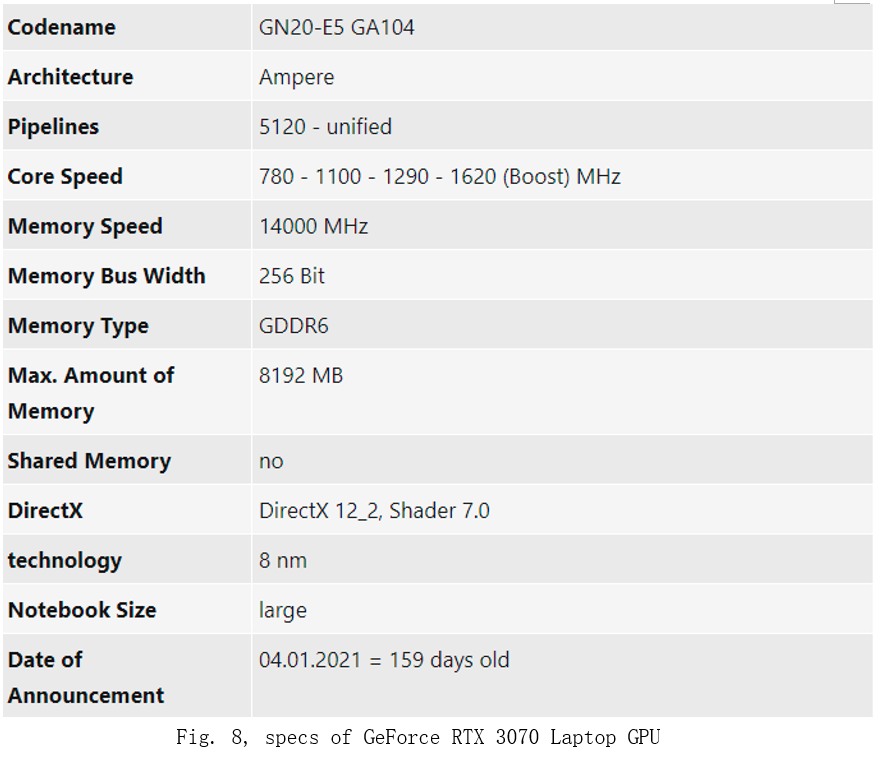
The runtime of this experiment greatly depends on the device. The GeForce RTX 3070 Laptop GPU, shown in Fig. 8, is used in this experiment. For training 50 epochs in total, it took 4 minutes to store the 25000 images of cifar-50 balanced dataset to GPU memory the first time, and the following 49 epochs took 35 minutes. The runtime varies greatly on different devices. I tried to train a cifar-50 balanced dataset on Google colab GPU, which has 2496 CUDA cores , 12GB GDDR5 VRAM[5]. The first epoch took 3.5 hours and the rest 49 epochs took 2 hours 5 minutes.
Different machine learning models influence the training time. As the model complexity (layers and neurons) increases, the runtime increases significantly. The model structure that I am using is shown in Fig. 9.
Results:
First, I train cnn models on balanced and all the imbalanced dataset without the re-weighted sampler or data augmentation. The hyper-parameters, loss function and optimizer are the same for all the training tasks: batch size: 32 epoch: 50 loss function: crossEntropyLoss optimizer: Stochastic gradient descent learning rate: 0.0001 momentum: 0.9 The result will be shown as confusion matrices, F1-scores and accuracies in Fig. 10, 11, 12, and 13[6][7]. I will use these data as a baseline to show by how much the re-weighted sampler and data augmentation can increase the performance on the imbalanced datasets.
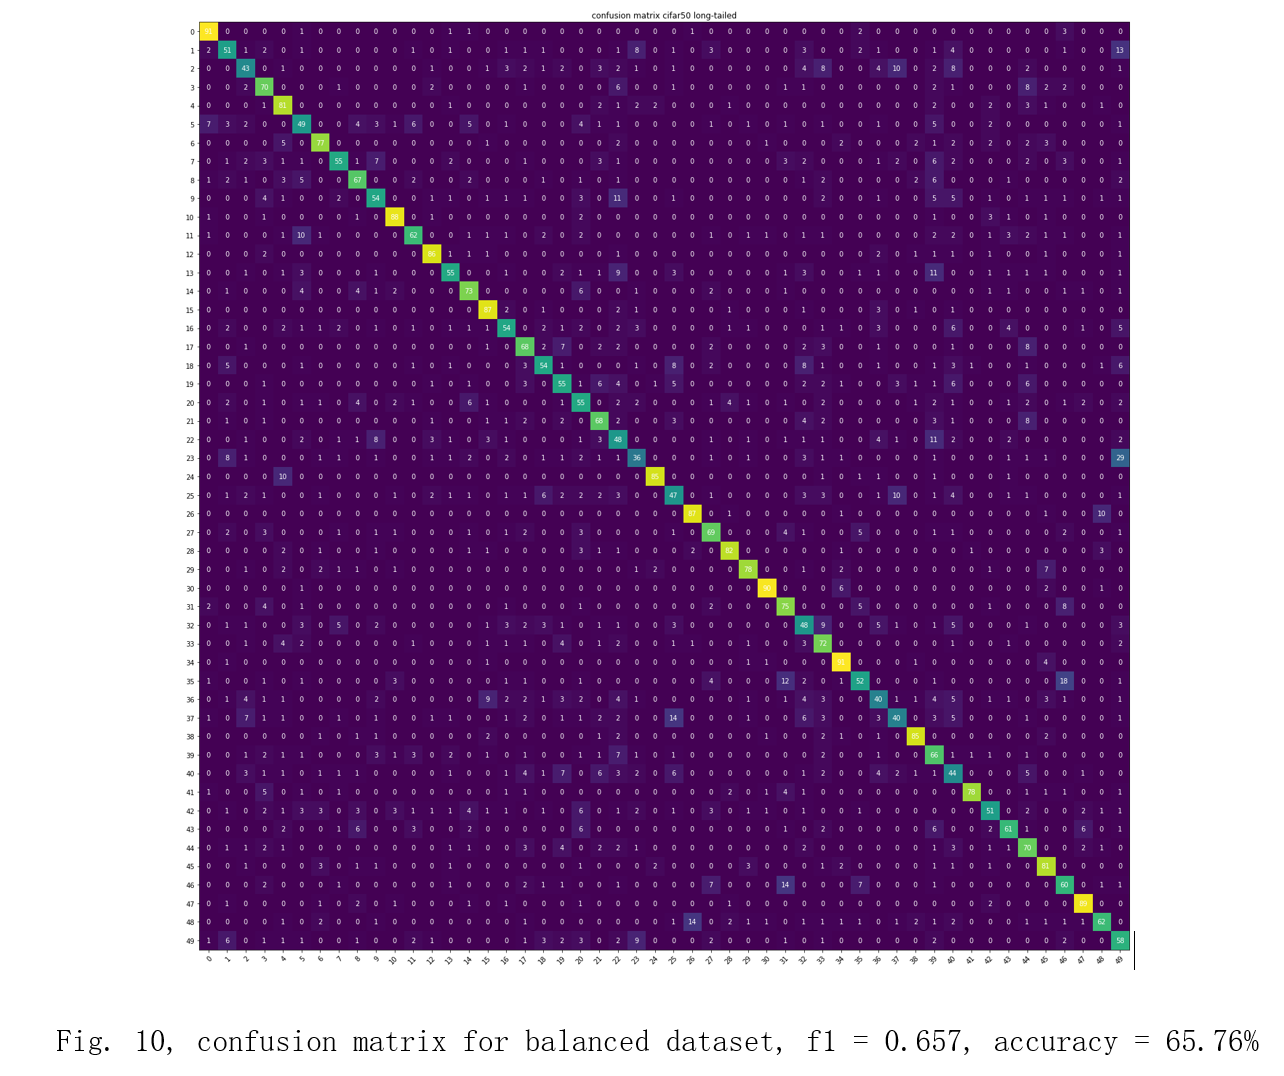
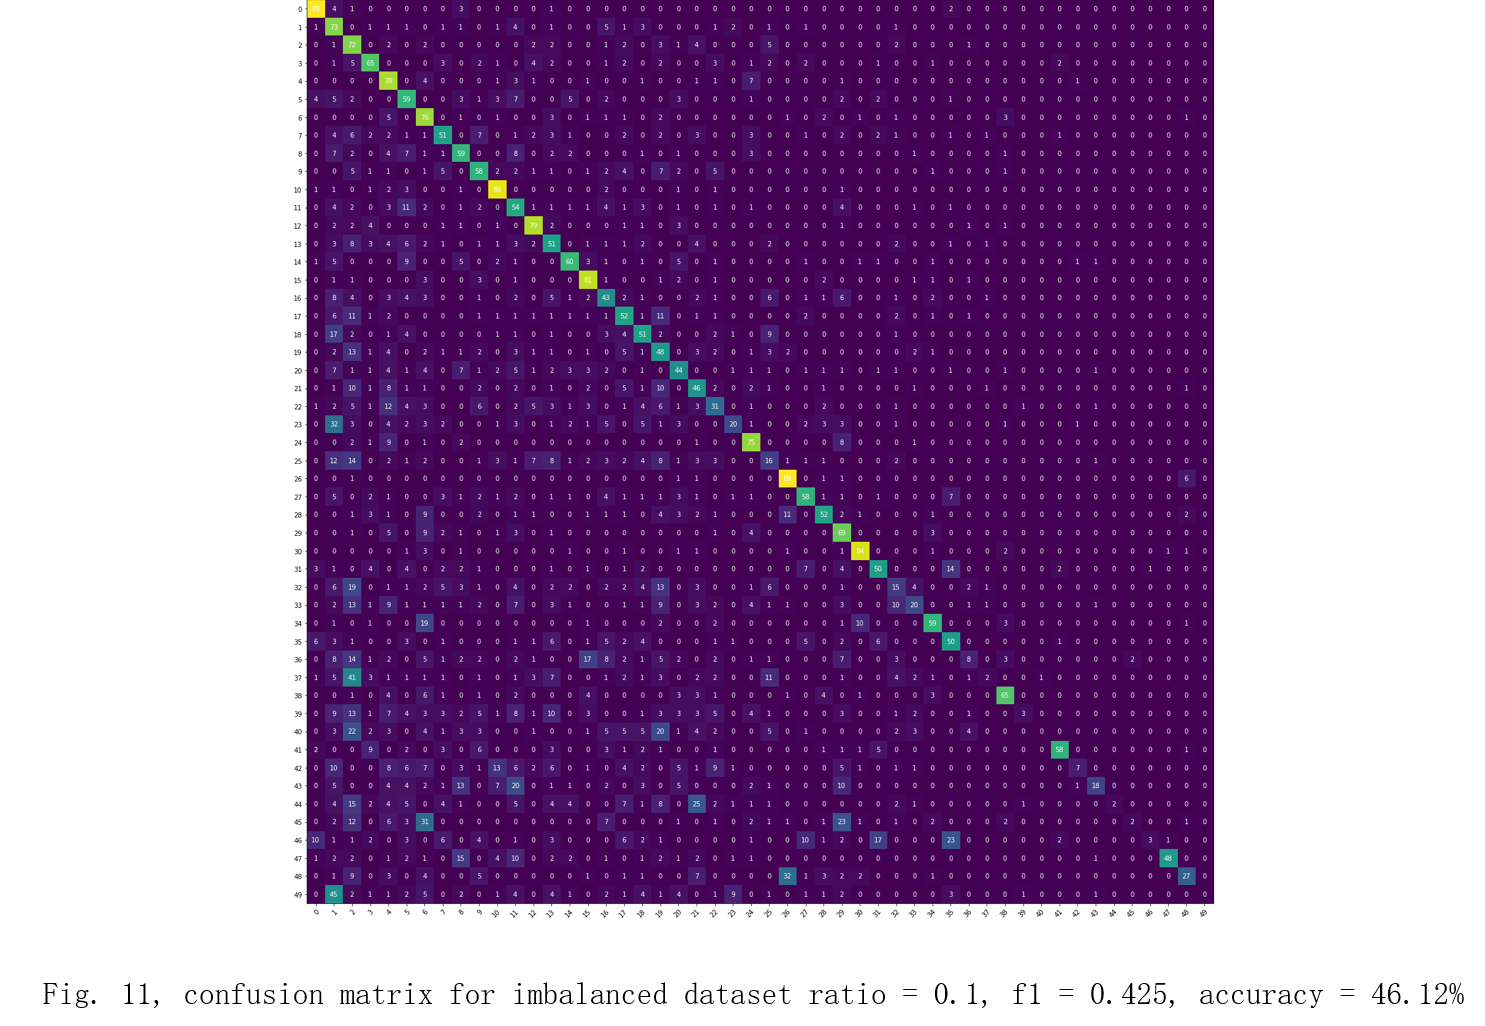
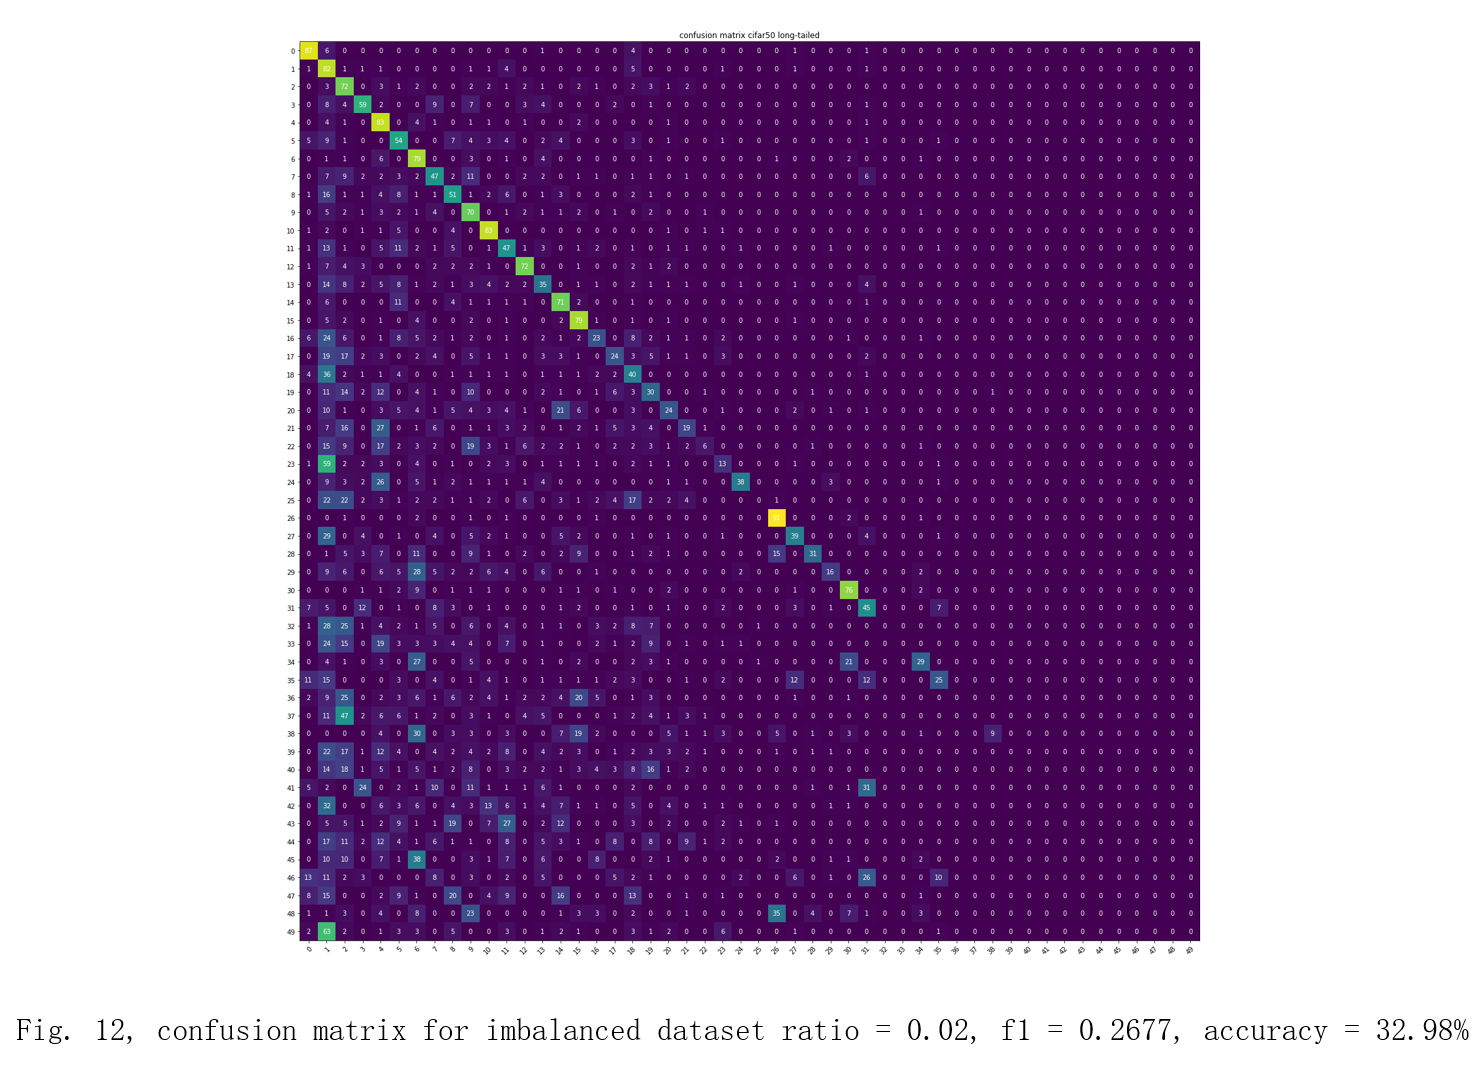
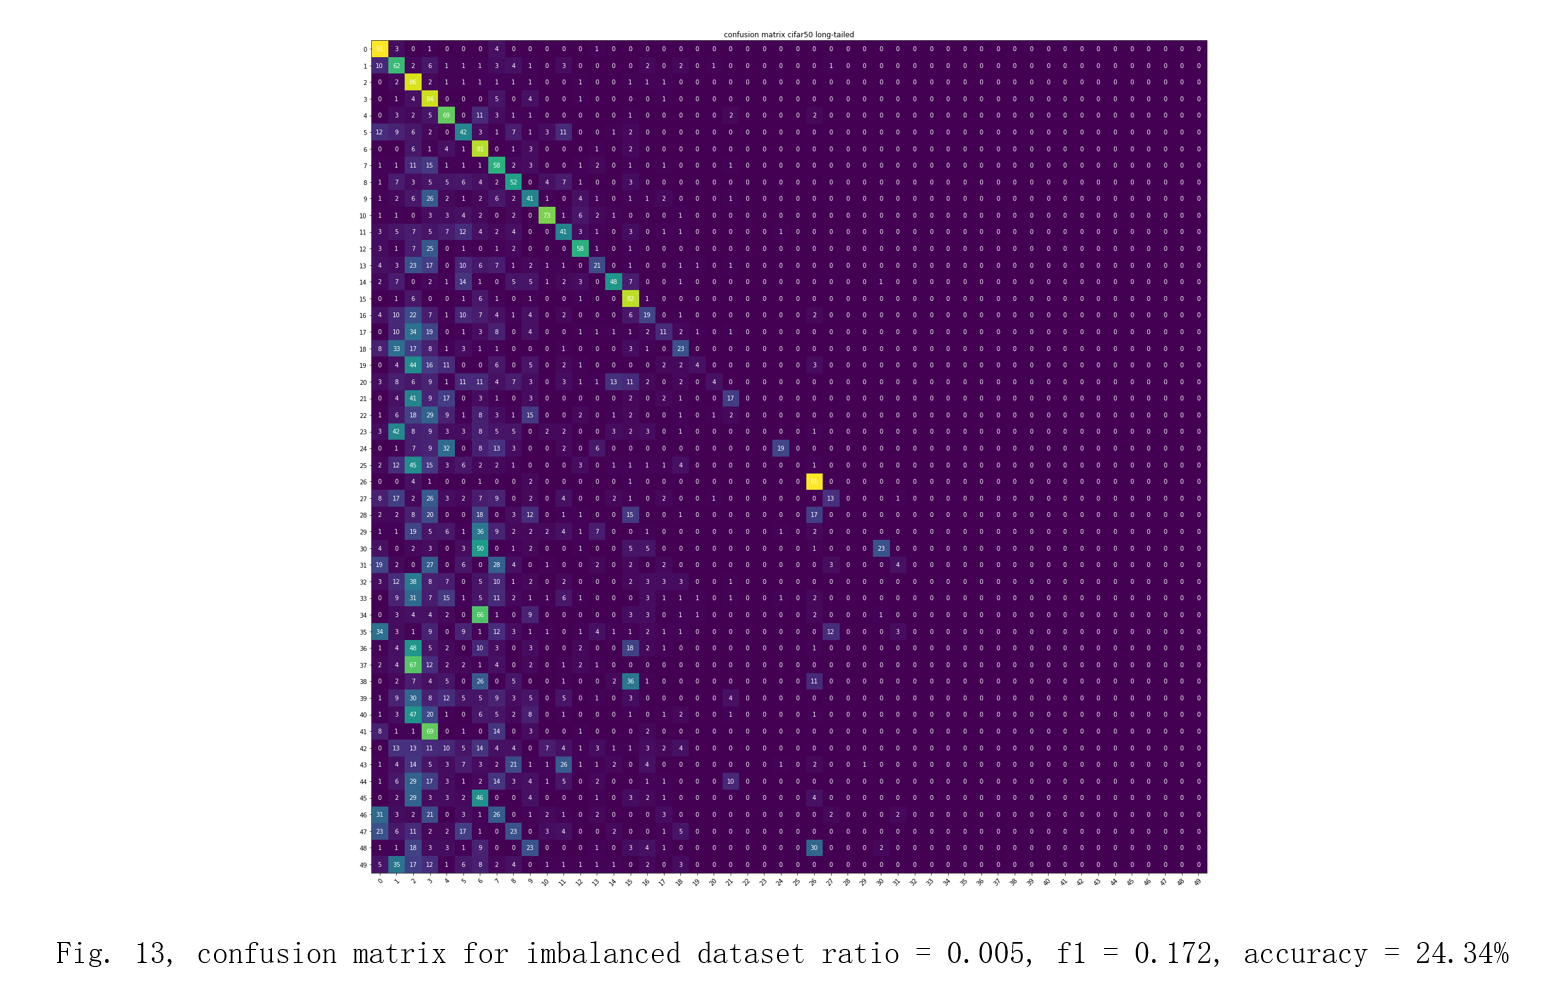
For the unimproved models trained on imbalanced datasets, they all have poor predictive performance on the minority classes as the imbalanced ratio increases, which can be seen in the bottom-right corner in the confusion matrices above.
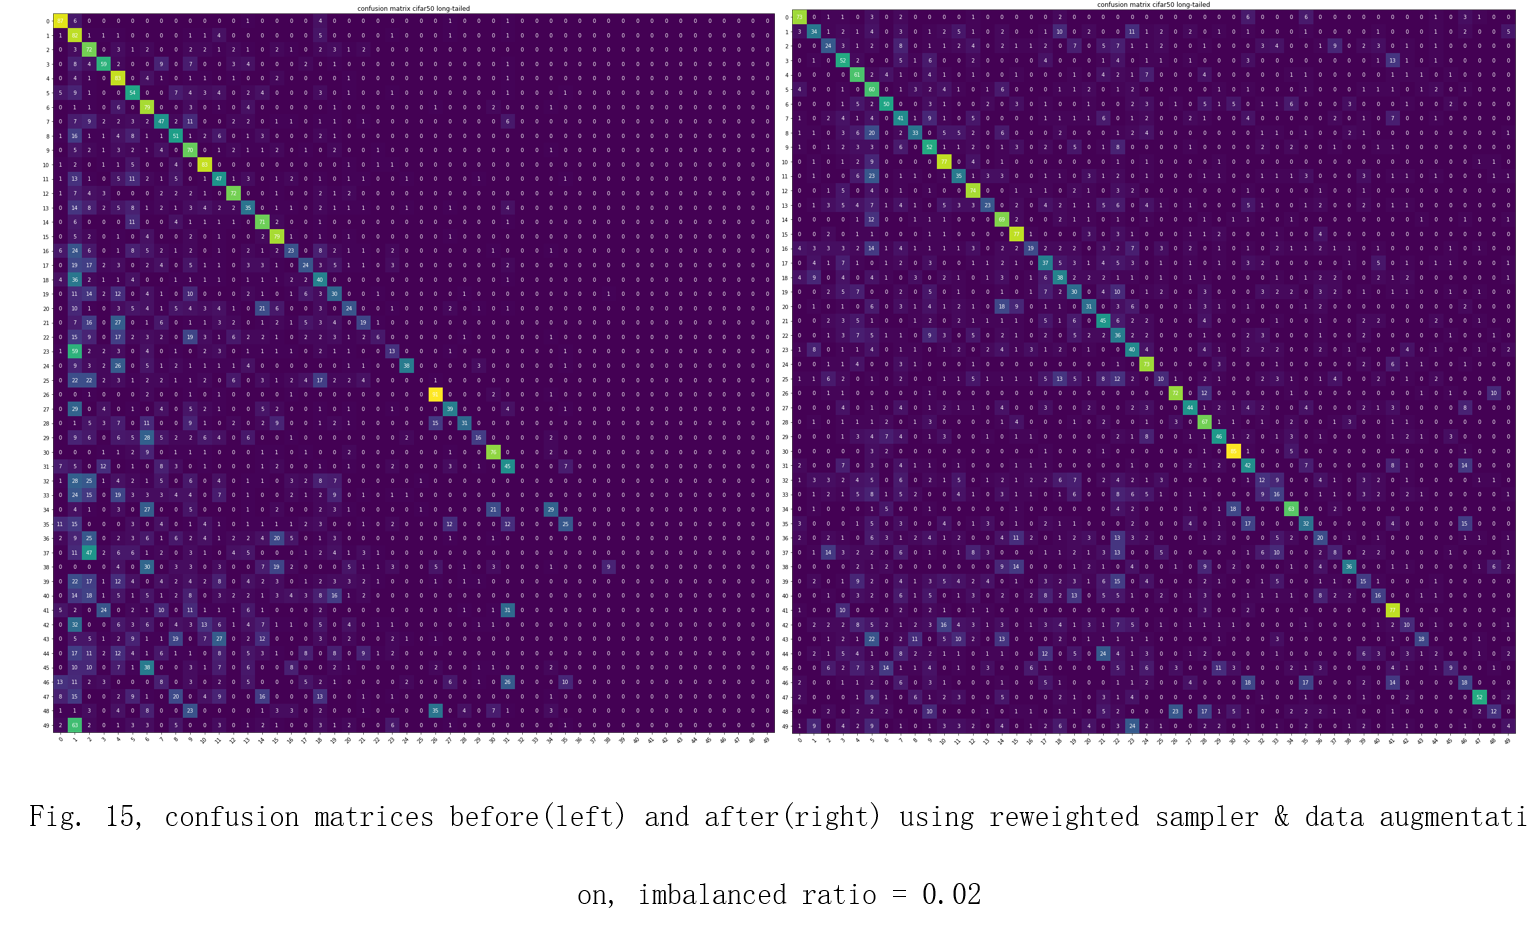
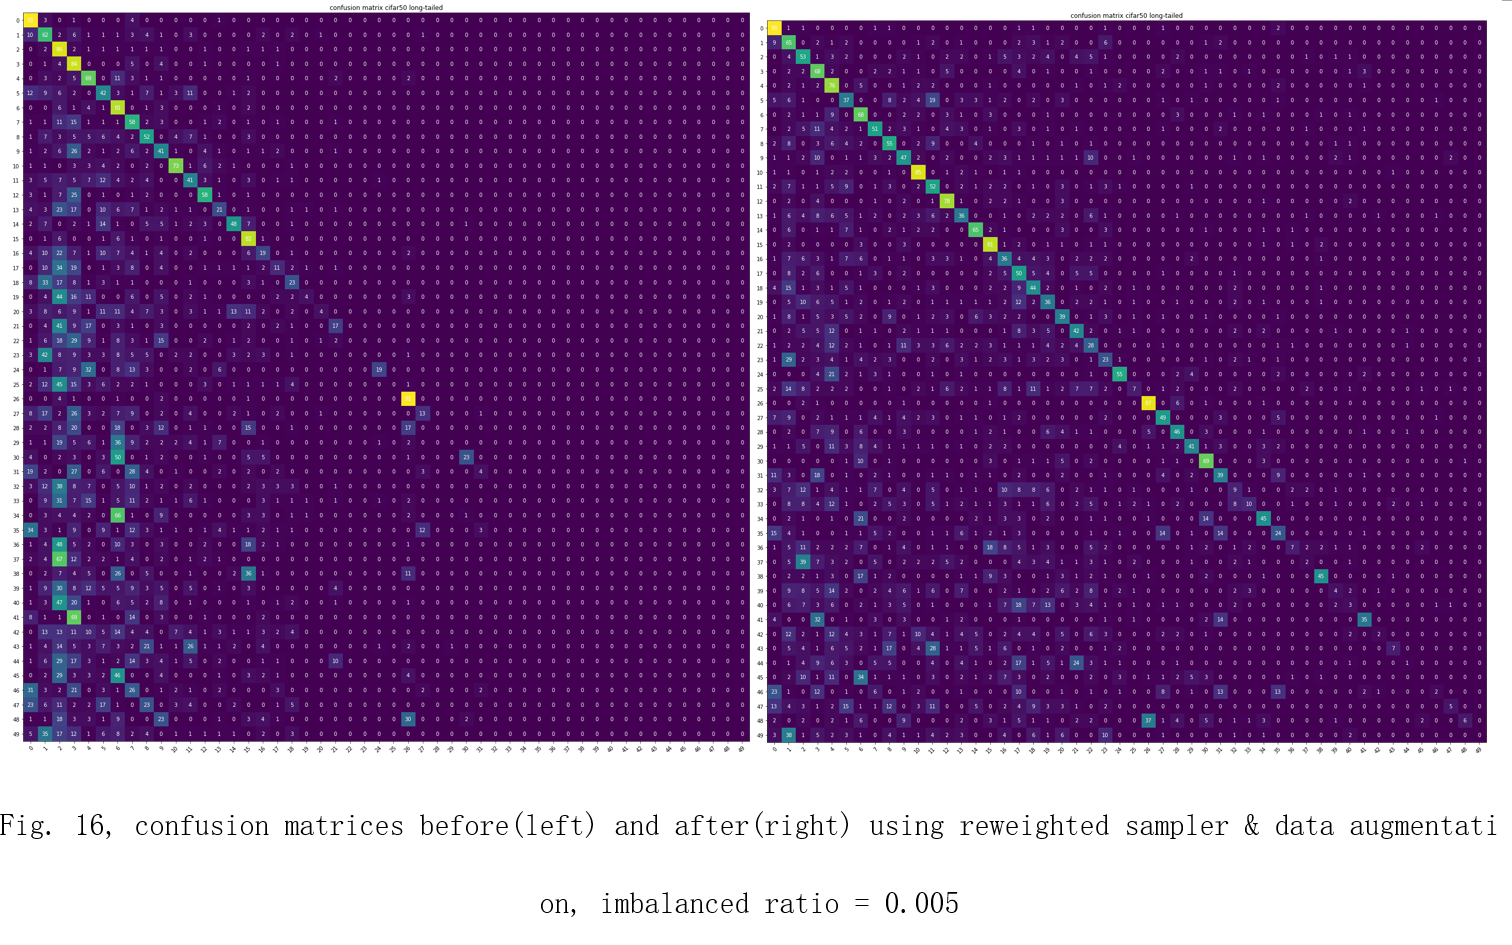
After applying re-weighted sampler and data augmentation techniques, the model’s ability to recognize the minority classes increases obviously. The confusion matrices are shown in Fig. 14, 15, 16.
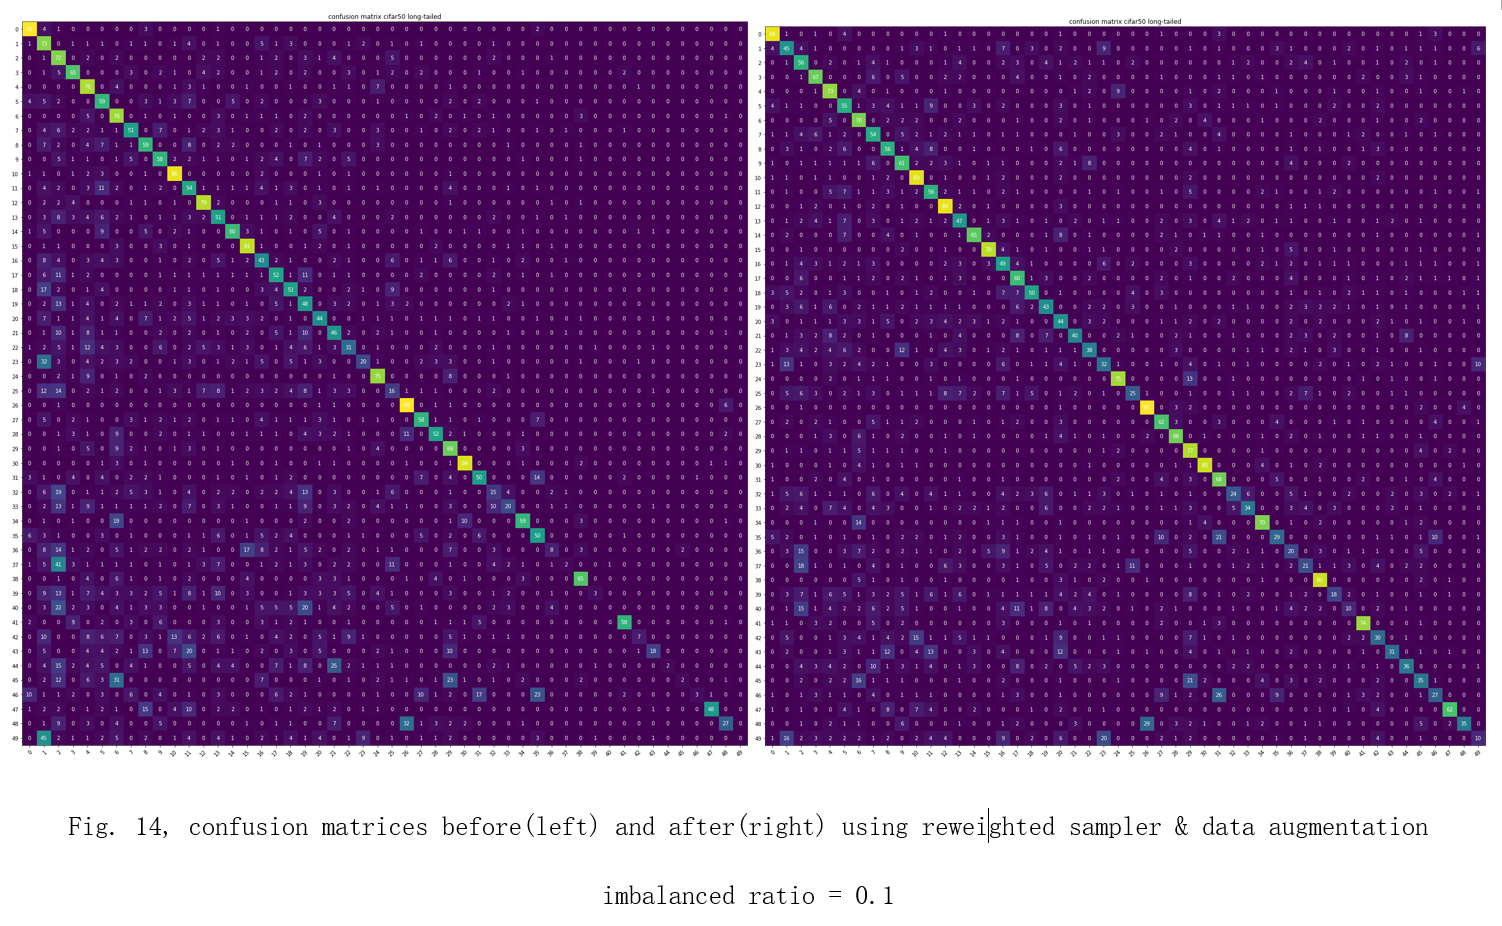
The increases in accuracy and F1-score are also significant. Overall, there is a 0.12 increase in F1-score and a 8.62% increase in accuracy on average. imbalanced ratio = 0.1 dataset without improvement weighted sampler & data augmentation F1-score 0.425 0.503 Accuracy 46.12% 51.56%
| imbalanced ratio = 0.02 | dataset without improvement | weighted sampler & data augmentation |
|---|---|---|
| F1-score | 0.2677 | 0.3714 |
| Accuracy | 32.98% | 39.4% |
| imbalanced ratio = 0.005 | dataset without improvement | weighted sampler & data augmentation |
|---|---|---|
| F1-score | 0.1717 | 0.3389 |
| Accuracy | 24.34% | 38.38% |
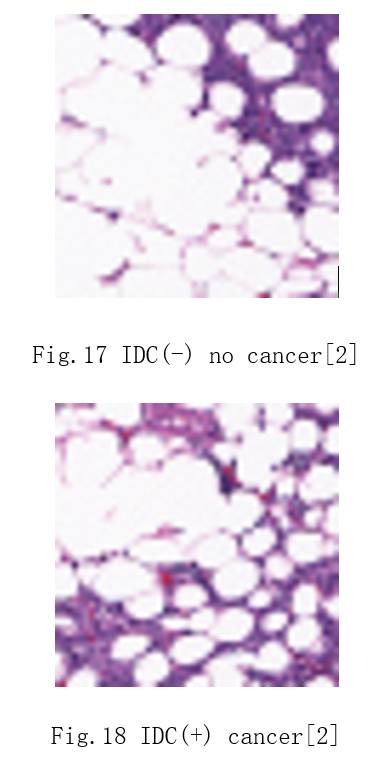
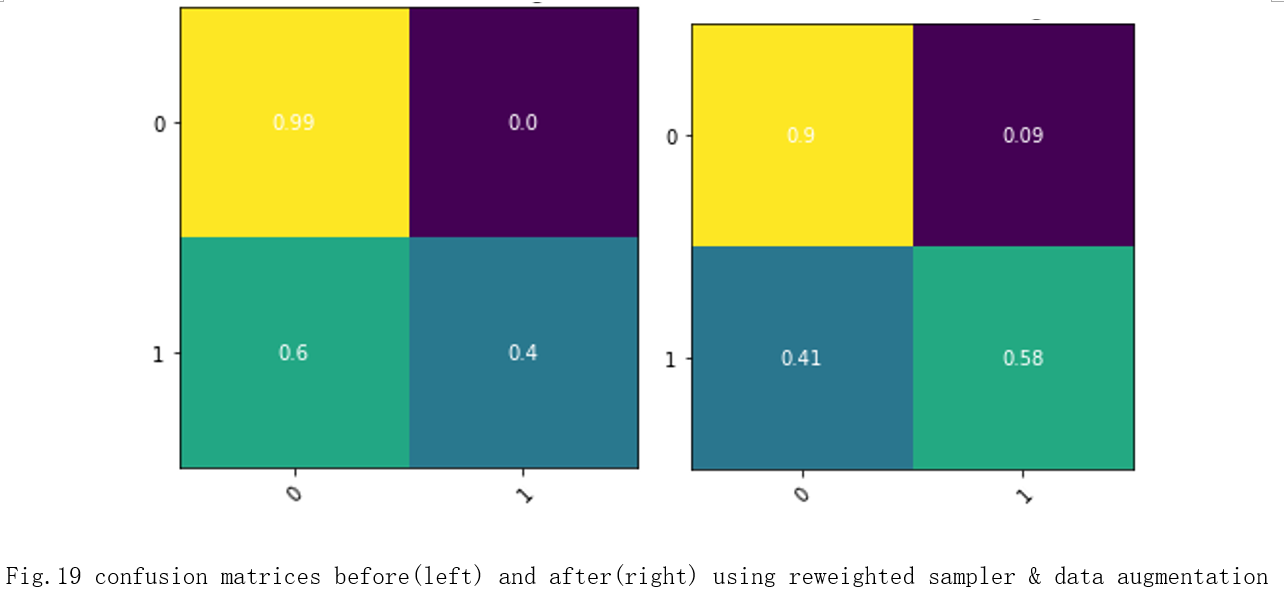
I also tried the improvement method on Breast Histopathology Images imbalanced dataset[2]. In this dataset, there are 772 images for IDC(-) and 76 images for IDC(+). Fig. 17 and Fig.18 are 2 example images for IDC(-) and IDC(+).
These results also match the results of training on the imbalanced cifar50 dataset. The confusion matrices are shown in Fig.19. The bottom-right corner is the accuracy of true positives for detecting cancer. There is an 18% increase in accuracy for true positives.
| Breast Histopathology Images imbalanced dataset | without improvement | weighted sampler & data augmentation |
|---|---|---|
| F1-score | 0.6673 | 0.7382 |
| Accuracy | 69.65% | 74.48% |
The method of the weighted sampler combined with data augmentation is easy to implement and useful, especially in improving the accuracy of the minority classes. This method is not only limited to the cifar50 dataset. It can also be used in other imbalanced datasets like breast cancer dataset and there will be a quick improvement on the performance. To further improve the performance, some techniques like re-weighted loss, mixup and increasing learning rate linearly can be combined with this method.
[1] Krizhevsky, A. (2009) Learning Multiple Layers of Features from Tiny Images. Technical Report TR-2009, University of Toronto, Toronto. [2] P. Mooney, “Breast Histopathology Images,” Kaggle, 19-Dec-2017. [Online]. Available:https://www.kaggle.com/paultimothymooney/breast-histopathology-images. [Accessed: 11-Jun-2021] [3] Y. Cui, M. Jia, T. Lin, Y. Song and S. Belongie, “Class-Balanced Loss Based on Effective Number of Samples,” 2019 IEEE/CVF Conference on Computer Vision and Pattern Recognition (CVPR), 2019, pp. 9260-9269, doi: 10.1109/CVPR.2019.00949. [4] P. Sharma, “Image Augmentation: Pytorch Image Augmentation,” Analytics Vidhya, 08-May-2020. [Online]. Available: https://www.analyticsvidhya.com/blog/2019/12/image-augmentation-deep-learning-pytorch/. [Accessed: 11-Jun-2021]. [5] K. Hinum, “NVIDIA GeForce RTX 3070 Mobile GPU - Benchmarks and Specs,” Notebookcheck, 08-Oct-2020. [Online]. Available: https://www.notebookcheck.net/NVIDIA-GeForce-RTX-3070-Mobile-GPU-Benchmarks-and-Specs.497451.0.html. [Accessed: 11-Jun-2021]. [6] “CNN Confusion Matrix with PyTorch - Neural Network Programming,” deeplizard. [Online]. Available: https://deeplizard.com/learn/video/0LhiS6yu2qQ. [Accessed: 11-Jun-2021]. [7] S. Rakshit, “Calculating Precision, Recall and F1 score in case of multi label classification,” PyTorch Forums, 29-Oct-2018. [Online]. Available: https://discuss.pytorch.org/t/calculating-precision-recall-and-f1-score-in-case-of-multi-label-classification/28265. [Accessed: 11-Jun-2021].