Plotting
One of the key features of NSTAT is its flexible plotting methodology. It is based on generic functions that operate on JSON input data, and therefore allows versatile mining and analysis of the results.
In specific, it allows the user to:
- specify in the JSON test configuration an arbitrary number of different plots to be produced
- easily configure plot axes, labels, etc., from result keys found in the JSON output file
- choose from a set of different plot types
The plots configuration key defines a set of plots to be drawn
over the results produced from a test. These results are
represented as a sequence of consecutive samples. As already mentioned,
these samples are formatted in a JSON file as an array of result objects,
where a result object is a collection of result keys.
A stripped down example of such an array is given below. Note however that:
- the result keys used in this example are not the actual ones, i.e. the ones produced by the idle and active tests
- the values in the example are random
[
{"switches":32, "hosts":100, "java_opts":"-Xms=8G", "throughput":700.0, "id":1, "controller":"ODL" },
{"switches":32, "hosts":100, "java_opts":"-Xms=8G", "throughput":1710.0, "id":2, "controller":"ODL" },
{"switches":32, "hosts":200, "java_opts":"-Xms=8G", "throughput":800.0, "id":3, "controller":"ODL" },
{"switches":32, "hosts":200, "java_opts":"-Xms=8G", "throughput":1120.0, "id":4, "controller":"ODL" },
{"switches":64, "hosts":100, "java_opts":"-Xms=8G", "throughput":1400.0, "id":5, "controller":"ODL" },
{"switches":64, "hosts":100, "java_opts":"-Xms=8G", "throughput":1850.0, "id":6, "controller":"ODL" },
{"switches":64, "hosts":200, "java_opts":"-Xms=8G", "throughput":1600.0, "id":7, "controller":"ODL" },
{"switches":64, "hosts":200, "java_opts":"-Xms=8G", "throughput":1690.0, "id":8, "controller":"ODL" },
{"switches":128, "hosts":100, "java_opts":"-Xms=8G", "throughput":2800.0, "id":9, "controller":"ODL" },
{"switches":128, "hosts":100, "java_opts":"-Xms=8G", "throughput":2900.0, "id":10, "controller":"ODL" },
{"switches":128, "hosts":200, "java_opts":"-Xms=8G", "throughput":3200.0, "id":11, "controller":"ODL" },
{"switches":128, "hosts":200, "java_opts":"-Xms=8G", "throughput":3900.0, "id":11, "controller":"ODL" },
{"switches":128, "hosts":200, "java_opts":"-Xms=8G", "throughput":3400.0, "id":12, "controller":"ODL" }
]
A plot object is a JSON object that configures a single plot. It has the following keys:
-
x_axis_key: the x-axis key (string) -
y_axis_key: the y-axis key (string) -
z_axis_key: the z-axis key (string, can benull) -
x_axis_label: descriptive label for the x-axis (string) -
y_axis_label: a descriptive label for the y-axis (string) -
plot_type: one of scatter, errorbar, errorbar_connected, multi_scatter, multi_errorbar, multi_errorbar_connected (string) -
plot_title: the plot title (string) -
plot_subtitle_keys: an array of keys to construct the plot subtitle (array of strings) -
plot_filename: filename of the produced plot (string) -
x_min,x_max,y_min,y_max: optional min/max values for the x/y axes (numbers, can be null) -
x_axis_factor: the scaling factor for x-axis (string) -
y_axis_factor: the scaling factor for y-axis (string) -
x_axis_scale: the scaling type for x-axis it can be one of the following linear, log (string) -
y_axis_scale: the scaling type for y-axis it can be one of the following linear, log (string)
In the above list, the x_axis_key, y_axis_key, z_axis_key and
plot_subtitle_keys options should be initialized with a result key from
the result file.
The best way to explore the different plot types is through sample plot objects operating on the sample result file given above.
{
"x_axis_key": "switches",
"y_axis_key": "throughput",
"z_axis_key": none,
"x_axis_label": "number of switches",
"y_axis_label": "throughput (flows/sec)",
"plot_type": "errorbar",
"plot_title": "controller throughput",
"plot_subtitle_keys": ["java_opts", "controller"],
"plot_filename": "errorbar.png",
"x_min":null,
"x_max":null,
"y_min":0,
"y_max":null
"x_axis_factor":"1.0",
"y_axis_factor":"1.0",
"x_axis_scale": "linear",
"y_axis_scale": "linear"
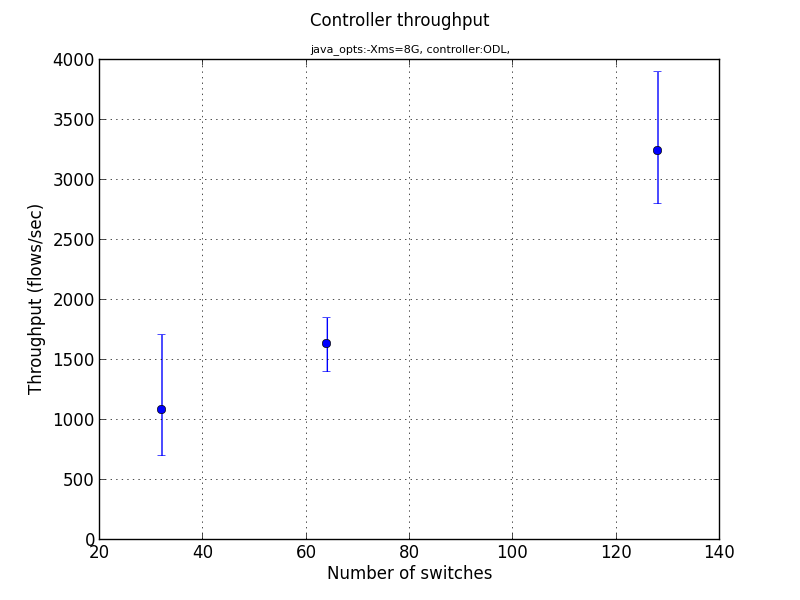
}The above plot object will draw a single collection of errorbars over
the specified x- and y-axis keys. If there are multiple result objects
(samples) for a given value of x_axis_key, the framework will
compute min/max and average values over the corresponding y_axis_key
values and will draw the appropriate errorbars.
The produced result is shown below.
{
    "x_axis_key": "switches",
    "y_axis_key": "throughput",
    "z_axis_key": none,
    "x_axis_label": "number of switches",
    "y_axis_label": "throughput (flows/sec)",
    "plot_type": "errorbar_connected",
    "plot_title": "controller throughput",
    "plot_subtitle_keys": ["java_opts", "controller"],
    "plot_filename": "errorbar.png",
    "x_min":null,
    "x_max":null,
    "y_min":0,
    "y_max":null,
    "x_axis_factor":"1.0",
    "y_axis_factor":"1.0",
    "x_axis_scale": "linear",
    "y_axis_scale": "linear"
}
As above, but now errorbars are connected with lines.

{
    "x_axis_key": "switches",
    "y_axis_key": "throughput",
    "z_axis_key": none,
    "x_axis_label": "number of switches",
    "y_axis_label": "throughput (flows/sec)",
    "plot_type": "scatter",
    "plot_title": "controller throughput",
    "plot_subtitle_keys": ["java_opts", "controller"],
    "plot_filename": "errorbar.png",
    "x_min":null,
    "x_max":null,
    "y_min":0,
    "y_max":null,
    "x_axis_factor":"1.0",
    "y_axis_factor":"1.0",
    "x_axis_scale": "linear",
    "y_axis_scale": "linear"
}
The above plot object will draw a scatter-plot over the specified x- and y-axis keys. The produced result is shown below.

{
    "x_axis_key": "switches",
    "y_axis_key": "throughput",
    "z_axis_key": "hosts",
    "x_axis_label": "number of switches",
    "y_axis_label": "throughput (flows/sec)",
    "plot_type": "multi_errorbar",
    "plot_title": "controller throughput",
    "plot_subtitle_keys": ["java_opts", "controller"],
    "plot_filename": "multi_errorbar.png",
    "x_min":null,
    "x_max":null,
    "y_min":0,
    "y_max":null,
    "x_axis_factor":"1.0",
    "y_axis_factor":"1.0",
    "x_axis_scale": "linear",
    "y_axis_scale": "linear"
}
The multi_errorbar type behaves exactly as the simple errorbar,
but now there are multiple collections of errorbars grouped-by the
specified z-axis key. If there are multiple result objects (samples)
for a given combination of x_axis_key,z_axis_key, the framework
will compute min/max and average values over the corresponding y_axis_key
values and will draw the appropriate errorbars.
The produced result is shown below.

{
    "x_axis_key": "switches",
    "y_axis_key": "throughput",
    "z_axis_key": "hosts",
    "x_axis_label": "number of switches",
    "y_axis_label": "throughput (flows/sec)",
    "plot_type": "multi_errorbar_connected",
    "plot_title": "controller throughput",
    "plot_subtitle_keys": ["java_opts", "controller"],
    "plot_filename": "multi_errorbar_connected.png",
    "x_min":null,
    "x_max":null,
    "y_min":0,
    "y_max":null,
    "x_axis_factor":"1.0",
    "y_axis_factor":"1.0",
    "x_axis_scale": "linear",
    "y_axis_scale": "linear"
}
As above, but now errorbars are connected with lines.

{
"x_axis_key": "switches",
"y_axis_key": "throughput",
"z_axis_key": "hosts",
"x_axis_label": "number of switches",
"y_axis_label": "throughput (flows/sec)",
"plot_type": "multi_scatter",
"plot_title": "controller throughput",
"plot_subtitle_keys": ["java_opts", "controller"],
"plot_filename": "multi_scatter.png",
"x_min":null,
"x_max":null,
"y_min":0,
"y_max":null,
"x_axis_factor":"1.0",
"y_axis_factor":"1.0",
"x_axis_scale": "linear",
"y_axis_scale": "linear"
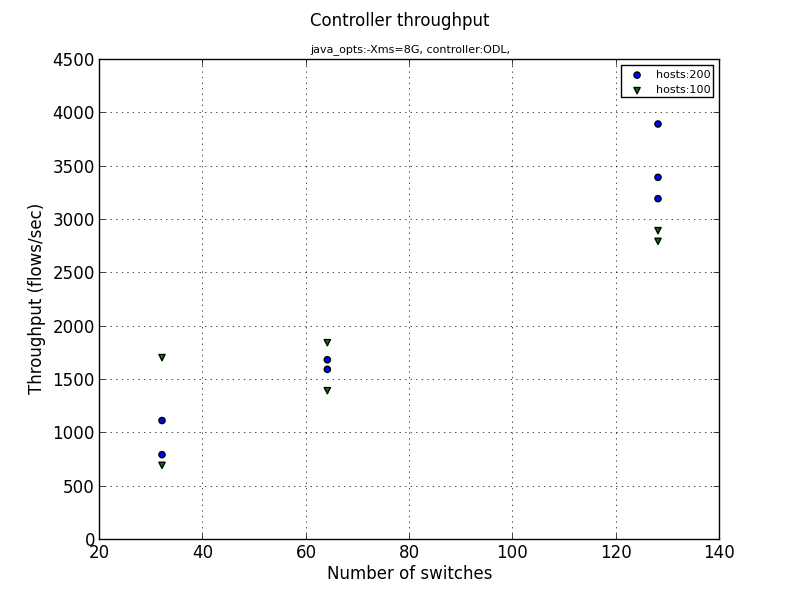
}Similarly to the multi_errorbar type, multi_scatter will
draw a scatter-plot over the specified x-axis grouped-by the
specified z-axis key. The produced result is shown below.
The above functionality is implemented in the util/plot_json.py module.
It is by no means coupled to the NSTAT testing logic, and therefore could be
used as a generic plotting methodology for JSON files following an array of
objects structure as the sample file above.