Here is a working codepen example.
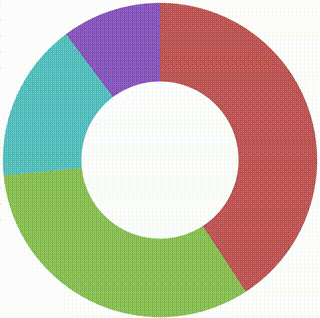
This is an example of a zoomable pie chart using d3.js. When you click on a slice of the pie chart, the slice is replaced by its children and a transition is launched, squishing the parents until they disappear while the children takes their place on the chart. The idea is to work as a zoomable sunburst in a way, but with only one level visible. You can replace the children by an AJAX call to retrieve the children from the server or simply create your own dataset and modify the code to fit your needs.
<div id="container">
  <div id="chart"></div>
</div>#container {
position: absolute;
top: 0;
left: 0;
height: 100%;
width: 100%;
}
#chart {
height: calc(100% - 2rem);
width: calc(100% - 2rem);
margin: 1rem;
display: flex;
justify-content: center;
}/*
* An example to create an interactable pie chart.
* Author: jberli, 2025
*
* Click on the red slice to start the animation.
*/
// The parents representing the starting slices.
var parents = [
// Only parent1 have children in this example.
{ name: "parent1", value: 200 },
{ name: "parent2", value: 160 },
{ name: "parent3", value: 50 },
{ name: "parent4", value: 80 },
];
// The children of the parent1 object, their sum equals the parent1 value.
// They can represent a returned object from an ajax.
var children = [
{ name: "children1", value: 20 },
{ name: "children2", value: 30 },
{ name: "children3", value: 30 },
{ name: "children4", value: 50 },
{ name: "children5", value: 50 },
{ name: "children6", value: 10 },
{ name: "children7", value: 10 },
];
var container = document.getElementById("chart");
const width = container.offsetWidth;
const height = width;
// Outer radius.
const outer = height / 2;
// Inner radius.
const inner = outer * 0.5;
// Set up a color interpolation from red to red.
const color1 = d3.color("hsl(0, 45%, 55%)");
const color2 = d3.color("hsl(360, 45%, 55%)");
const interpolation = d3.interpolateHslLong(color1, color2);
// Set up the color generator based on the parents dataset.
var color = d3.scaleOrdinal(d3.quantize(interpolation, parents.length + 1));
// Sort the parents by descending value.
parents.sort((a, b) => b.value - a.value);
// Add a color parameter to the parents objects.
parents.forEach((parent, index) => parent.color = color(index) );
// Create a responsive svg.
var svg = d3.create("svg").attr("viewBox", [-width / 2, -height / 2, width, height]);
// Set up the arc generator.
var arc = d3.arc().innerRadius(inner).outerRadius(outer);
// Set up the pie slice generator without sorting => important when children
// will be inserted in place of their parent.
const pie = d3.pie().value(d => d.value).sort(null);
// Create the svg paths using the slice generator.
var path = svg.selectAll("path").data(pie(parents), d => d.data.name);
path.enter()
.append("path")
// Fill the slice with the data color parameter.
.attr("fill", d => d.data.color)
.attr("d", arc)
.attr("value", d => d.data.value)
.style("cursor", "pointer")
// Store the current slice value for the future transition animation.
.each( function(d) { this._current = d })
// Click event on the slice.
.on("click", function (event, d) {
// Here, make sure this is the parent1 object, just for this example.
if (d.data.name === "parent1") {
// Sort the children by descending value.
children.sort((a, b) => b.value - a.value);
// Recalculate the color scale and assign the right value to the children.
color = d3.scaleOrdinal(d3.quantize(interpolation, children.length + 1));
children.forEach((child, i) => child.color = color(i) );
// Recreate the data by inserting the children in place of the parent.
var data = parents.slice(0, d.index).concat(children).concat(parents.slice(d.index + 1));
// Launch the function to slice the parent in its children.
subslice(data, d.index, d.index + children.length);
}
});
// Append the svg to the container.
container.appendChild(svg.node());
/*
* This function regenerate the pie chart and slice the clicked parent
* into its children.
*/
function subslice(data, start, end) {
// Regenerate the slices using the new data.
var sectors = svg.selectAll("path").data(pie(data), d => d.data.name)
sectors.enter()
.append("path")
// Color them according to their color parameter.
.attr("fill", d => d.data.color)
.attr("value", d => d.data.value)
.style("cursor", "pointer")
// Store the new current value after adding the children for the future transition.
.each( function(d) { this._current = d })
// Remove the parent that has been replaced.
sectors.exit().remove();
// Change the value of all other parents to zero.
data.forEach((child, i) => { if (i < start || i >= end) { child.value = 0; } });
// Launch the animation
animation(data);
}
/*
* This function animates the pie chart to squich the parents and expand the children.
*/
function animation(data) {
// Calculate the slices using the new data with zeroed parents.
var sectors = svg.selectAll("path").data(pie(data), d => d.data.name);
// Launch the animation.
sectors.transition()
.duration(5000)
.ease(d3.easeQuadOut)
.attrTween("d", arcTween)
.on("end", function(d) {
// Remove the squished parent at the end of the animation.
if (d.data.value === 0) d3.select(this).remove();
});
}
/*
* The tween animation function.
*/
function arcTween(a) {
const i = d3.interpolate(this._current, a);
this._current = i(1);
return (t) => arc(i(t));
}