matplotlib.mbt is an innovative tool built upon python.mbt, empowering developers to harness the capabilities of the powerful Python plotting library, Matplotlib, using the Moonbit language. By doing so, we can leverage Moonbit's robust type safety features and modern language ecosystem to bring a fresh perspective to data visualization.
Before diving into matplotlib.mbt, please ensure your development environment is properly configured.
Important Note: This project requires Python 3.9 or higher. For the best experience, we strongly recommend using the latest stable version.
💡 Recommended: Use Anaconda: For data science and machine learning projects, we highly recommend installing Anaconda. Anaconda is a distribution of Python and conda package manager, which includes many commonly used data science libraries (such as NumPy, SciPy, Matplotlib, etc.), helping you manage Python environments and dependencies more easily.
🐧 Linux (Debian/Ubuntu)
If you are not using Anaconda, please ensure that Python 3.9 or higher and the Python development headers are installed on your system.
sudo apt-get update && sudo apt-get install python3.13 python3.13-dev🍎 macOS (Homebrew)
brew install [email protected]🪟 Windows
- Visit the official Python website
- Download the latest 3.x version installer
- During installation, make sure to check the "Add Python to PATH" option
matplotlib.mbt relies on the Python Matplotlib library. You can install it using pip, Python's package installer.
If you do not have Anaconda installed, open your terminal or command prompt and run the following command:
Bash
pip install matplotlib
If you have installed Anaconda, Matplotlib is usually pre-installed. If it's not, you can install it using conda:
Bash
conda install matplotlib
Verifying your Python version and obtaining the Python development header file path are crucial for the subsequent configuration.
# Check Python version
python3 --version

# Get Python development header file path
python3-config --prefixFollow these steps to configure your matplotlib.mbt project.
First, update your package index and install the matplotlib library:
moon update
moon add Kaida-Amethyst/matplotlibModify the moon.pkg.json file in your project's root directory by adding the following configuration:
{
  "import": [
    {
      "path" : "Kaida-Amethyst/matplotlib",
      "alias" : "plt"
    }
  ],
  "link": {
    "native": {
      "cc": "$CC",
      "cc-flags": "$CC_FLAGS",
      "cc-link-flags": "$CC_LINK_FLAGS"
    }
  }
}To enable Moonbit to interact correctly with Python, you need to configure some essential environment variables.
🐧🍎 Linux/macOS (env.sh):
#!/bin/bash
export PY_VERSION=$(python3 -c "import sys; print(f'{sys.version_info.major}.{sys.version_info.minor}')")
export CC=clang  # 🚀 We recommend using the clang compiler for better performance
export CC_FLAGS="-I$(python3-config --prefix)/include/python$PY_VERSION -O2 -DNDEBUG"
export CC_LINK_FLAGS="$(python3-config --ldflags) -lpython$PY_VERSION"
export C_INCLUDE_PATH="$(python3-config --prefix)/include/python$PY_VERSION:$C_INCLUDE_PATH"
Remember to execute this script in your shell:
source env.sh🪟 Windows PowerShell (env.ps1):
$PY_PATH = (python -c "import sys; print(sys.prefix)") | Out-String
$env:PY_VERSION = python -c "import sys; print(f'{sys.version_info.major}.{sys.version_info.minor}')"
$env:CC = "clang"
$env:CC_FLAGS = "-I$($PY_PATH.Trim())\include -O2 -DNDEBUG"
$env:CC_LINK_FLAGS = "-L$($PY_PATH.Trim())\libs -lpython$env:PY_VERSION"
Run this script in PowerShell:
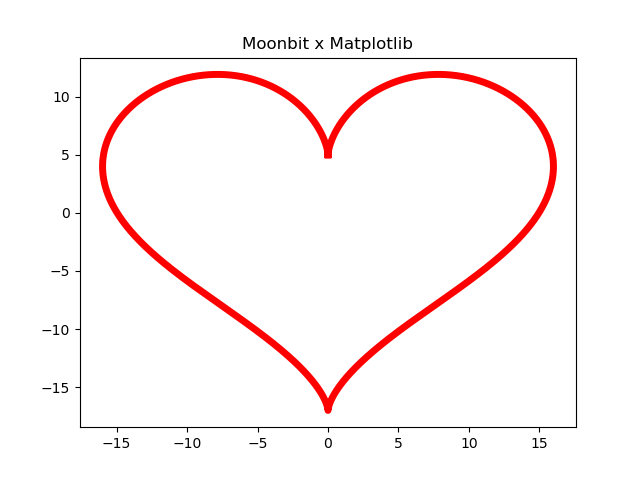
. .\env.ps1Let's draw a romantic heart curve using matplotlib.mbt!
let sin : (Double) -> Double = @math.sin
let cos : (Double) -> Double = @math.cos
const PI: Double = @math.PI

fn main {
  let n = 5000 // Number of data points
  let t : Array[Double] = Array::makei(n, fn (i) {2.0 * PI * i.to_double() / n.to_double()})
  let xs = t.map(fn (t) {16.0 * sin(t) * sin(t) * sin(t)})
  let ys = t.map(fn (t) {13.0 * cos(t) - 5.0 * cos(2.0 * t) - 2.0 * cos(3.0 * t) - cos(4.0 * t)})

  let (_, axes) = @plt.subplots(1, 1)
  let ax = axes[0][0]

  ax.plot(xs, ys, color=@plt.Red, linewidth=5)
  ax.set_title("Moonbit x Matplotlib")
  @plt.show()
}
Running this Moonbit code:
moon run main.mbt --target nativeIt will generate a beautiful heart-shaped plot, like this:
The equivalent Python code is as follows for your comparison:
import numpy as np
import matplotlib.pyplot as plt

n = 5000
t = np.linspace(0, 2 * np.pi, n)
x = 16 * np.sin(t)**3
y = 13 * np.cos(t) - 5 * np.cos(2*t) - 2 * np.cos(3*t) - np.cos(4*t)

fig, ax = plt.subplots()

ax.plot(x, y, color='red', linewidth = 5)
ax.set_title("Moonbit x Matplotlib")

plt.show()We warmly welcome your contributions to make matplotlib.mbt even better! You can contribute in the following ways:
- 🐛 Submit Issues to report any problems you encounter
- 🛠️ Submit Pull Requests to contribute your code improvements
- 📝 Enhance the documentation to help more people understand and use
matplotlib.mbt
📜 License: Apache-2.0 License (see the LICENSE file for details)
matplotlib.mbt 是一个基于 python.mbt 的创新工具,它赋予开发者使用 Moonbit 语言操控强大的 Python 绘图库 Matplotlib 的能力。通过这种方式,我们可以充分利用 Moonbit 语言卓越的类型安全特性和现代化的语言生态,为数据可视化带来全新的体验。
在使用 matplotlib.mbt 之前,请确保你的开发环境已正确配置。
重要提示:本项目要求 Python 3.9 或更高版本。为了获得最佳体验,我们强烈建议使用最新的稳定版本。
💡 推荐使用 Anaconda:对于数据科学和机器学习项目,我们强烈推荐安装 Anaconda。Anaconda 是一个包含了 Python、conda 包管理器以及众多常用数据科学库(如 NumPy, SciPy, Matplotlib 等)的发行版本,它可以帮助你更轻松地管理 Python 环境和依赖。
🐧 Linux (Debian/Ubuntu)
如果你不使用 Anaconda,请确保你的系统安装了 Python 3.9 或更高版本以及 Python 的开发文件。
sudo apt-get update && sudo apt-get install python3.13 python3.13-dev🍎 macOS (Homebrew)
brew install [email protected]🪟 Windows
- 访问 Python 官方网站
- 下载最新的 3.x 版本安装包
- 在安装过程中,请务必勾选 "Add Python to PATH" 选项
matplotlib.mbt 需要依赖 Python 的 Matplotlib 库。你可以使用 pip(Python 的包管理器)来安装它。
如果你没有安装 Anaconda,请打开你的终端或命令提示符并运行以下命令:
Bash
pip install matplotlib
如果你使用了 Anaconda,Matplotlib 通常已经预装。如果未安装,你可以使用 conda 来安装:
Bash
conda install matplotlib
验证你的 Python 版本以及获取 Python 开发头文件路径对于后续的配置至关重要。
# 检查 Python 版本
python3 --version

# 获取 Python 开发头文件路径
python3-config --prefix按照以下步骤配置你的 matplotlib.mbt 项目。
首先,更新你的包索引并安装 matplotlib 库:
moon update
moon add Kaida-Amethyst/matplotlib修改你项目根目录下的 moon.pkg.json 文件,添加以下配置信息:
{
  "import": [
    {
      "path" : "Kaida-Amethyst/matplotlib",
      "alias" : "plt"
    }
  ],
  "link": {
    "native": {
      "cc": "$CC",
      "cc-flags": "$CC_FLAGS",
      "cc-link-flags": "$CC_LINK_FLAGS"
    }
  }
}为了让 Moonbit 能够正确地与 Python 交互,你需要配置一些必要的环境变量。
🐧🍎 Linux/macOS (env.sh):
#!/bin/bash
export PY_VERSION=$(python3 -c "import sys; print(f'{sys.version_info.major}.{sys.version_info.minor}')")
export CC=clang  # 🚀 推荐使用 clang 编译器以获得更佳的性能
export CC_FLAGS="-I$(python3-config --prefix)/include/python$PY_VERSION -O2 -DNDEBUG"
export CC_LINK_FLAGS="$(python3-config --ldflags) -lpython$PY_VERSION"
export C_INCLUDE_PATH="$(python3-config --prefix)/include/python$PY_VERSION:$C_INCLUDE_PATH"
记得在你的 shell 中执行这个脚本:
source env.sh🪟 Windows PowerShell (env.ps1):
$PY_PATH = (python -c "import sys; print(sys.prefix)") | Out-String
$env:PY_VERSION = python -c "import sys; print(f'{sys.version_info.major}.{sys.version_info.minor}')"
$env:CC = "clang"
$env:CC_FLAGS = "-I$($PY_PATH.Trim())\include -O2 -DNDEBUG"
$env:CC_LINK_FLAGS = "-L$($PY_PATH.Trim())\libs -lpython$env:PY_VERSION"
在 PowerShell 中运行此脚本:
. .\env.ps1让我们用 matplotlib.mbt 画一个浪漫的心形曲线吧!
let sin : (Double) -> Double = @math.sin
let cos : (Double) -> Double = @math.cos
const PI: Double = @math.PI

fn main {
  let n = 5000 // Number of data points
  let t : Array[Double] = Array::makei(n, fn (i) {2.0 * PI * i.to_double() / n.to_double()})
  let xs = t.map(fn (t) {16.0 * sin(t) * sin(t) * sin(t)})
  let ys = t.map(fn (t) {13.0 * cos(t) - 5.0 * cos(2.0 * t) - 2.0 * cos(3.0 * t) - cos(4.0 * t)})

  let (_, axes) = @plt.subplots(1, 1)
  let ax = axes[0][0]

  ax.plot(xs, ys, color=@plt.Red, linewidth=5)
  ax.set_title("Moonbit x Matplotlib")
  @plt.show()
}
运行这段 Moonbit 代码,使用下面的命令:
moon run main.mbt --target native你将会看到一个美丽的心形曲线图,就像这样:
等效的 Python 代码如下:
import numpy as np
import matplotlib.pyplot as plt

n = 5000
t = np.linspace(0, 2 * np.pi, n)
x = 16 * np.sin(t)**3
y = 13 * np.cos(t) - 5 * np.cos(2*t) - 2 * np.cos(3*t) - np.cos(4*t)

fig, ax = plt.subplots()

ax.plot(x, y, color='red', linewidth = 5)
ax.set_title("Moonbit x Matplotlib")

plt.show()我们非常欢迎你的加入,一起让 matplotlib.mbt 变得更好!你可以通过以下方式参与贡献:
- 🐛 提交 Issue 报告你发现的问题
- 🛠️ 发起 Pull Request 贡献你的代码改进
- 📝 完善文档,让更多人了解和使用
matplotlib.mbt
📜 许可证:Apache-2.0 License(详细内容请查看 LICENSE 文件)