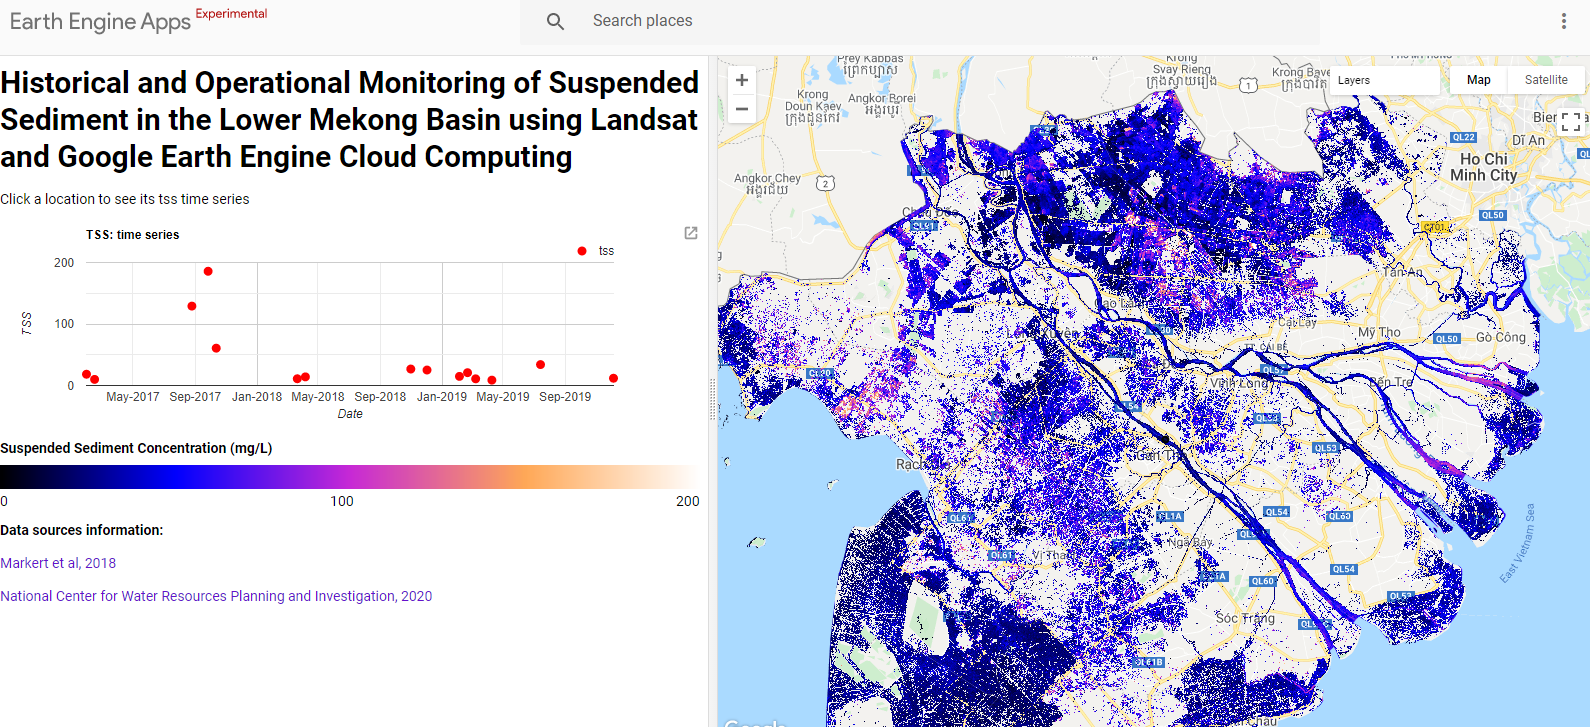
Monitoring of Suspended Sediment in the Mekong Delta (Vietnam) Using Landsat and Google Earth Engine
#Link to GEE App: https://ndminhhus.users.earthengine.app/view/tssmk
https://code.earthengine.google.com/b4ddb93eb867efa6ebc6081a17cebe25
Adapted from (https://www.mdpi.com/2072-4292/10/6/909)
var lmbRegion = ee.FeatureCollection('ft:1FOW0_lYQNG3ku2ffNyoORbzDXglPvfMyXmZRb8dj');
// var lt4 = ee.ImageCollection('LANDSAT/LT04/C01/T1_SR'); var lt5 = ee.ImageCollection('LANDSAT/LT05/C01/T1_SR').map(l5mask_F); // var le7 = ee.ImageCollection('LANDSAT/LE07/C01/T1_SR'); var lc8 = ee.ImageCollection('LANDSAT/LC08/C01/T1_SR').map(l8mask_F);
// lt4 = lt4.select(['B1','B2','B3','B4','B5','B7','pixel_qa'],['blu','grn','red','nir','swir1','swir2','pixel_qa']); lt5 = lt5.select(['B1','B2','B3','B4','B5','B7','pixel_qa'],['blu','grn','red','nir','swir1','swir2','pixel_qa']); // le7 = le7.select(['B1','B2','B3','B4','B5','B7','pixel_qa'],['blu','grn','red','nir','swir1','swir2','pixel_qa']); lc8 = lc8.select(['B2','B3','B4','B5','B6','B7','pixel_qa'],['blu','grn','red','nir','swir1','swir2','pixel_qa']);
var fullCollection = ee.ImageCollection(lt5.merge(lc8)); var start = '2016-11-01'; var end = '2020-01-01';
fullCollection = fullCollection.filterDate(start,end).filterBounds(mk)
var col = fullCollection .filter(ee.Filter.lt('CLOUD_COVER',30)) .map(TSS_cal) // .select('nir') // .map(landmask) // print(col.size()) // Map.addLayer(col.first(),{min:0,max:2500,bands:['red','grn','blu']},'first cloud masked') var waterMask = col.select('nir').mean().clip(lmbRegion); // Map.addLayer(waterMask,{palette:['blue']},'waterMask',true) // Map.addLayer(col.first(),{min:0,max:3000,bands:['red','grn','blu']},'rgb first',true)
//////APP here///////////// // Create the main map.
var tss_viz = {min:0,max:200,palette:['000000','0000ff','c729d6','ffa857','ffffff']} var tss_mean = col.mean().select('tss').clip(mk);
var mapPanel = ui.Map();
mapPanel.addLayer(tss_mean, tss_viz,'tss mean');
var inspectorPanel = ui.Panel({style: {width: '45%'}});
// Create an intro panel with labels. var intro = ui.Panel([ ui.Label({ value: 'Historical and Operational Monitoring of Suspended Sediment in the Lower Mekong Basin using Landsat and Google Earth Engine Cloud Computing', style: {fontSize: '30px', fontWeight: 'bold'} }), ui.Label('Click a location to see its tss time series') ]); inspectorPanel.add(intro);
// Create panels to hold lon/lat values. var lon = ui.Label(); var lat = ui.Label(); inspectorPanel.add(ui.Panel([lon, lat], ui.Panel.Layout.flow('horizontal')));
//time series data var tss_col = col.select('tss') var generateChart = function (coords) { // Update the lon/lat panel with values from the click event. lon.setValue('lon: ' + coords.lon.toFixed(2)); lat.setValue('lat: ' + coords.lat.toFixed(2));
// Add a dot for the point clicked on. var point = ee.Geometry.Point(coords.lon, coords.lat); var dot = ui.Map.Layer(point, {color: 'black'}, 'clicked location'); // Add the dot as the fourth layer, so it shows up on top of the composite.
mapPanel.layers().set(1, dot);
// Make a chart from the time series. var sstChart = ui.Chart.image.series(tss_col, point, ee.Reducer.mean(), 30);
// Customize the chart. sstChart.setOptions({ title: 'TSS: time series', vAxis: {title: 'TSS'},min:0,max:200, hAxis: {title: 'Date', format: 'MMM-yyyy', gridlines: {count: 12}}, series: { 0: { color: 'red', lineWidth: 0, //pointsVisible: true, pointSize: 7, }, 1: { color: 'blue', lineWidth: 0, //pointsVisible: true, pointSize: 7, }, 2: { color: 'orange', lineWidth: 0, //pointsVisible: true, pointSize: 7, }, 3: { color: 'green', lineWidth: 1, //pointsVisible: true, lineVisible:true, pointSize: 2, }, }, legend: {position: 'right'}, }).setChartType('LineChart'); // Add the chart at a fixed position, so that new charts overwrite older ones. inspectorPanel.widgets().set(1, sstChart); };
mapPanel.onClick(generateChart);
// Configure the map. mapPanel.style().set('cursor', 'crosshair');
var initialPoint = ee.Geometry.Point(105.75705654981297,10.086920780015202);//roi1 mapPanel.centerObject(initialPoint, 9);
ui.root.clear(); ui.root.add(ui.SplitPanel(inspectorPanel, mapPanel));
generateChart({ lon: initialPoint.coordinates().get(0).getInfo(), lat: initialPoint.coordinates().get(1).getInfo() });
// // Create a hyperlink to an external reference. // var link = ui.Label( // 'Reference', {fontSize:'11px'}, // 'https://doi.org/10.3390/rs10060909'); // var linkPanel = ui.Panel( // [ui.Label('', {fontSize:'11px'}), link]); // inspectorPanel.add(linkPanel);
// Create the legend. //LEGEND START/// function makeColorBarParams(palette) { return { bbox: [0, 0, 1, 0.1], dimensions: '200x10', format: 'png', min: 0, max: 1, palette: palette, }; } // Create the color bar for the legend. var colorBar = ui.Thumbnail({ image: ee.Image.pixelLonLat().select(0), params: makeColorBarParams(tss_viz.palette), style: {stretch: 'horizontal', margin: '0px 8px', maxHeight: '24px'}, }); // Create a panel with three numbers for the legend. var legendLabels = ui.Panel({ widgets: [ // ui.Label(viz.min, {margin: '4px 8px'}), ui.Label('0', {margin: '4px 8px'}), ui.Label( // (viz.max / 2), '100', {margin: '4px 8px', textAlign: 'center', stretch: 'horizontal'}), ui.Label('200', {margin: '4px 8px'}) ], layout: ui.Panel.Layout.flow('horizontal') }); var legendTitle = ui.Label({ value: 'Suspended Sediment Concentration (mg/L)', style: {fontWeight: 'bold'} });
var legendPanel = ui.Panel([legendTitle, colorBar, legendLabels]); var keyPanel = ui.Panel(); inspectorPanel.add(legendPanel); //keyPanel.clear();
//LEGEND END///
///REFERENCES // Create a hyperlink to an external reference. //var link = ui.Label( //'Historical and Operational Monitoring of Suspended Sediment in the Lower Mekong Basin using Landsat and Google Earth Engine Cloud Computing', {}, ///'Markert et al, 2018',{}, //'https://doi.org/10.3390/rs10060909'); var link2 = ui.Label( 'National Center for Water Resources Planning and Investigation, 2020', {}, 'http://nawapi.gov.vn/'); var linkPanel = ui.Panel( [ui.Label('Data sources information:', {fontWeight: 'bold'}), link2] ); inspectorPanel.add(linkPanel);
// print(col.first().date())
//QA filtering (cloud_cover) //cloud mask //land mask //time serries //app
//General Functions function l5mask_F(img){ // var mask = img.select('pixel_qa').eq(66).or(img.select('pixel_qa').eq(68)) //keep water and land var mask = img.select('pixel_qa').eq(68) //keep water only return img.updateMask(mask); } function l8mask_F(img){ // var mask = img.select('pixel_qa').eq(322).or(img.select('pixel_qa').eq(324)) //keep water and land var mask = img.select('pixel_qa').eq(324) //keep water only return img.updateMask(mask); } function landmask(img){ //use this function if the satellite images are before 2015 var date = img.date(); var jrc = ee.ImageCollection('JRC/GSW1_0/MonthlyHistory'); // var blank = ee.Image(0) var waterClass = ee.Image(jrc.select('water').filterDate(date.advance(-30,'day'),date.advance(30,'day')).max()); // var water = blank.where(waterClass.eq(2),1); return img.updateMask(waterClass.eq(2)) } function TSS_cal(image){ // var t = ee.Date(image.get('system:time_start')); var red = image.select('red').multiply(0.0001); var grn = image.select('grn').multiply(0.0001); var ratio = red.divide(grn).log(); var logTss = ratio.expression('ae**(bX+c)', {'X': ratio, 'a': 1.90353307, 'b': 1.44788939, 'c': 0.62996462, 'e': 2.718281828459045, }); var tss = logTss.exp().rename(['tss']); return image.addBands(tss).updateMask(tss.lt(5000)) // mask bad quality TSS values over 5000 mg/L }
// def calcTSS(self,image): // t = ee.Date(image.get('system:time_start')) // red = image.select('red').multiply(0.0001) // grn = image.select('grn').multiply(0.0001) // ratio = red.divide(grn).log()
// logTss = ratio.expression('ae**(bX+c)',{ // 'X': ratio, // 'a': 1.90353307, // 'b': 1.44788939, // 'c': 0.62996462, // 'e': 2.718281828459045, // }); // tss = logTss.exp().set("system:time_start",t.millis()).rename(['tss'])
// return tss.updateMask(tss.lt(5000)) # mask bad quality TSS values over 5000 mg/L