d3heat - an interactive fixed-height and width heatmap with dendogram for EDGE display.
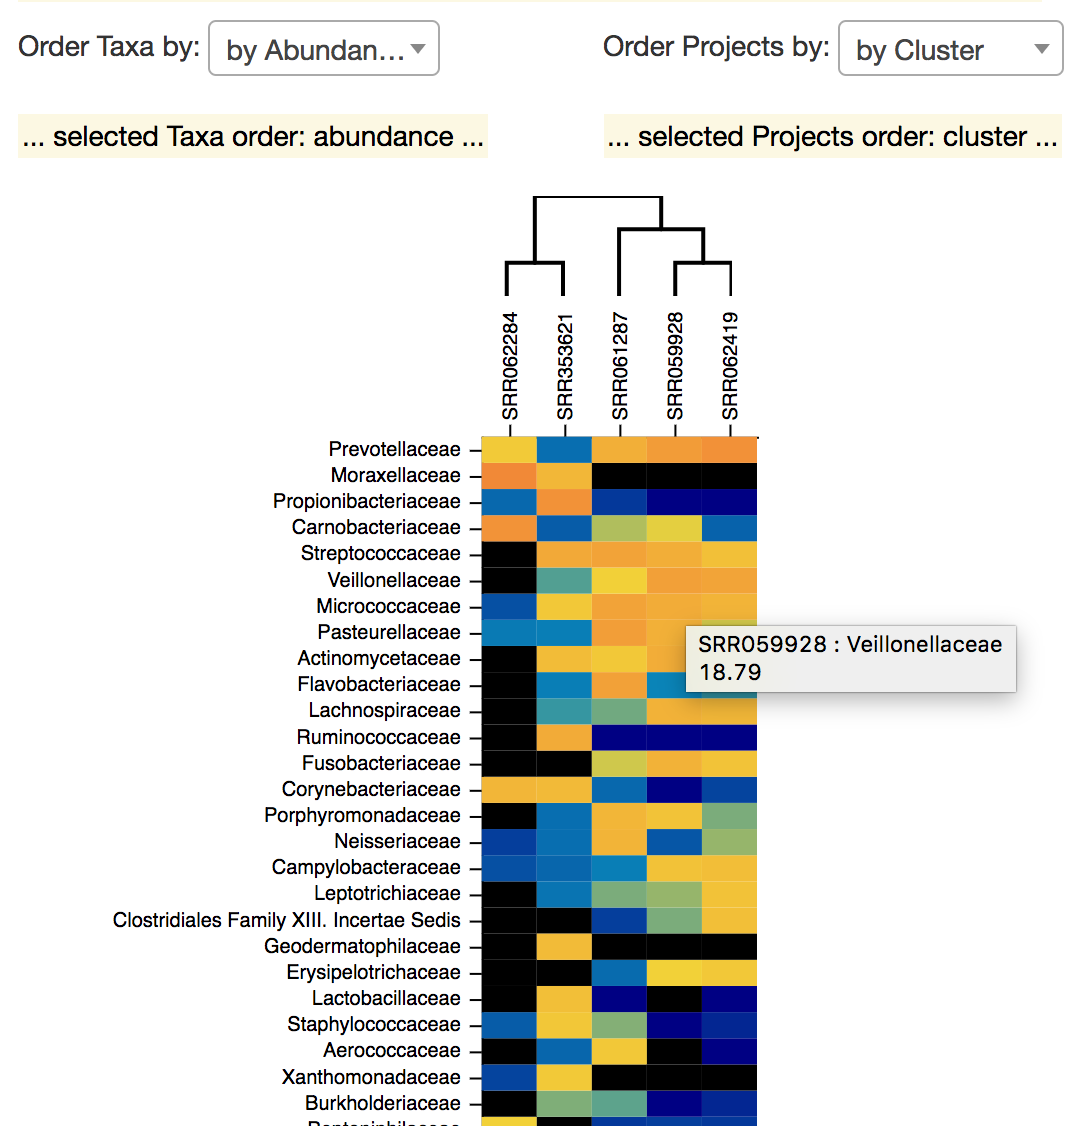
Currently the javascript code fetches with d3's d3.tsv a three-column TSV file formatted as abundance values for a pair of taxa and project:
"TAXA"	"PROJECT"	"ABUNDANCE"
"Acetobacteraceae"	"SRR059928"	0
"Cellulomonadaceae"	"SRR059928"	0
"Mycoplasmataceae"	"SRR059928"	0.02
"Clostridiaceae"	"SRR059928"	0.01
"Dermacoccaceae"	"SRR059928"	0.02
"Eubacteriaceae"	"SRR059928"	0
and a newick-formatted file for the dendogram
((SRR061287:0.3763049643,(SRR059928:0.2572599239,SRR062419:0.2572599239):0.1190450404):0.1236950357,(SRR062284:0.4593612658,SRR353621:0.4593612658):0.04063873418);
The heatmap code is built upon D3.js, the demo webpage uses Bootstrap, jQuery, and Select2 plugin for a pretty formatting.