Visualization codes from the first "speeding up science workshop". This repository contains codes to make heatmap and stacked bar plots for metatranscriptomic function and RNA-based taxonomy summaries. The demonstration shown here is using data from this paper by Michael D. Lee.
- Once the
is started, user will enter a virtual Rstudio interface.
- User can either excute the codes with included samples by clicking on the "function-summary.Rmd" and "taxa-summary.rmd" scripts or upload new data files by clicking the
Uploadbutton at the lower right panel. - To save a rendered html output, user can click the
knitrbutton at the upper left panel.
If the user want to normalize the count table, the "raw-to-TPM-conversion.R" script is included in this Binder to perform such task.
| CDS_ID | Low_A | Low_B | High_A | High_B | |
|---|---|---|---|---|---|
| 1 | CDS_100 | 10.980509 | 8.364332 | 28.15585 | 0.000000 |
| 2 | CDS_10011 | 2.284764 | 1.522854 | 10.25240 | 0.000000 |
| 3 | CDS_10013 | 9.833839 | 6.554506 | 0.00000 | 0.000000 |
| 4 | CDS_10015 | 7.194288 | 2.501831 | 0.00000 | 0.000000 |
| 5 | CDS_10016 | 0.000000 | 0.000000 | 44.98916 | 0.000000 |
| CDS_ID | Domain | Phylum | Class | Order | Family | Genus | Species | |
|---|---|---|---|---|---|---|---|---|
| 1 | CDS_2383 | Archaea | Euryarchaeota | Methanococci | Methanococcales | Methanocaldococcaceae | Methanocaldococcus | Methanocaldococcus_infernus |
| 2 | CDS_4184 | Archaea | Euryarchaeota | Methanomicrobia | Methanosarcinales | Methanosarcinaceae | Methanosarcina | Methanosarcina_barkeri |
| 3 | CDS_6601 | Archaea | Euryarchaeota | Methanomicrobia | Methanosarcinales | Methanosarcinaceae | Methanosarcina | Methanosarcina_barkeri |
| 4 | CDS_6904 | Archaea | Euryarchaeota | Methanococci | Methanococcales | Methanococcaceae | Methanococcus | Methanococcus_vannielii |
| 5 | CDS_7927 | Archaea | Euryarchaeota | Halobacteria | Natrialbales | Natrialbaceae | Haloterrigena | Haloterrigena_jeotgali |
| SampleID | Place | Group | |
|---|---|---|---|
| 1 | High_A | High | A |
| 2 | High_B | High | B |
| 3 | Low_A | Low | A |
| 4 | Low_B | Low | B |
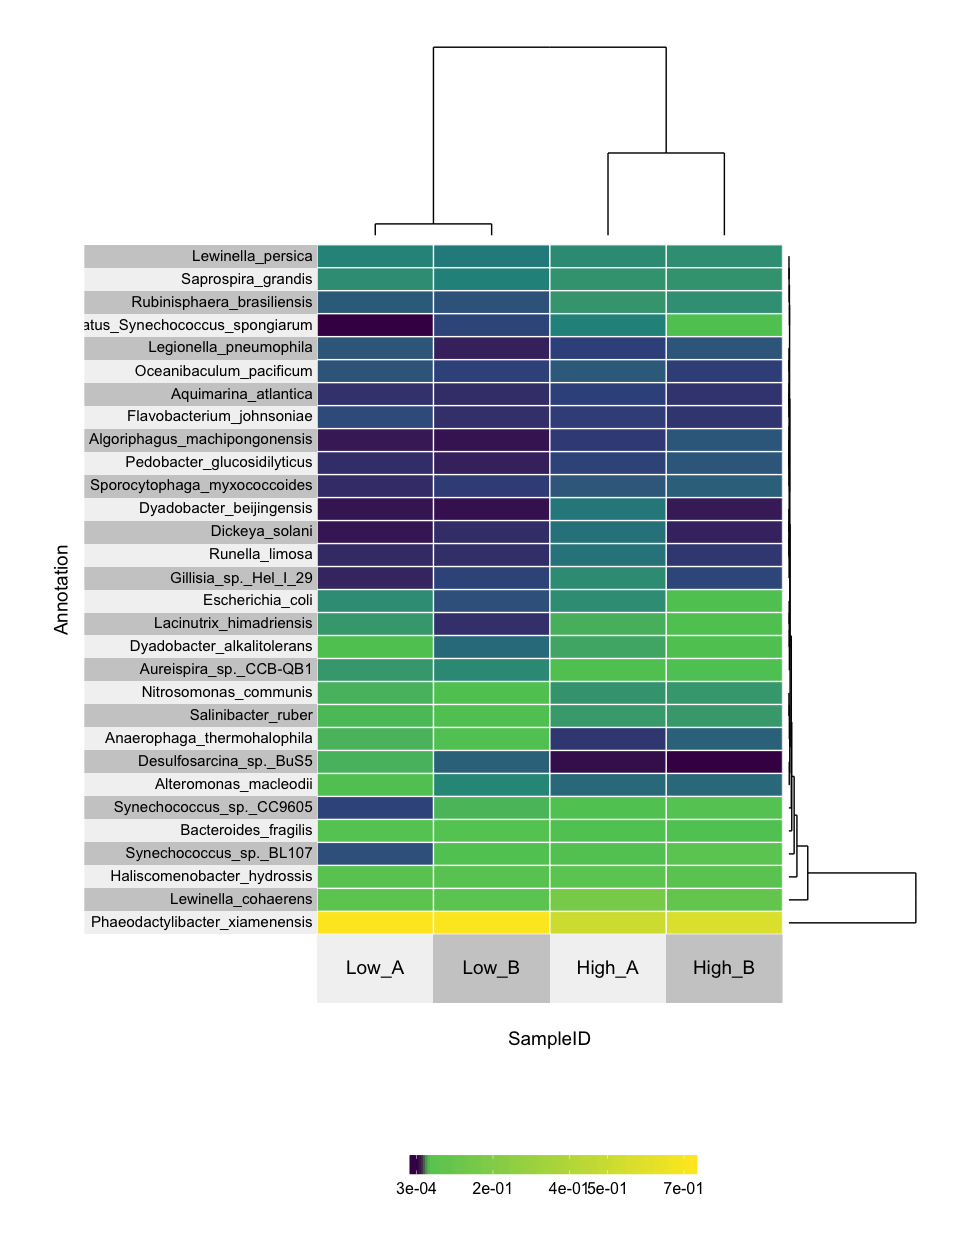
- Thumbnail of expected Heatmap
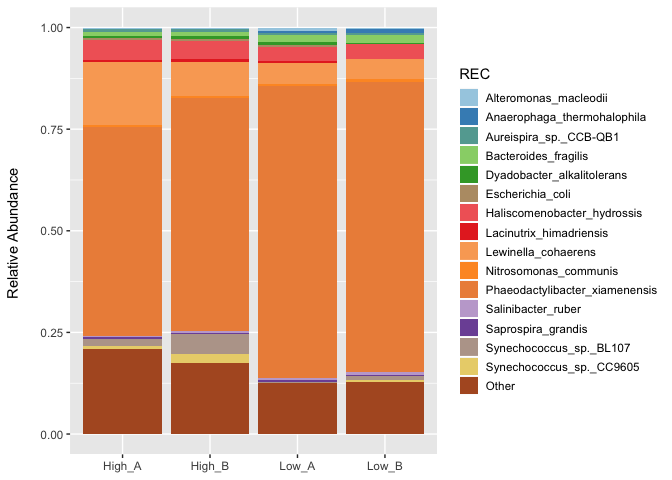
- Thumbnail of expected bar plot
- Zenodo Binder:
- Github Binder:
- Github Repository: https://github.com/zeyaxue/speeding-up-sci-heatmap-barplot