From the command line, quickly explore data from a CSV file.
shallow-explore is a Golang backed command-line tool for iterating over columns from a CSV file. This is a gut check tool to make sure the assumptions about the data are within the expected range of normal.
After installation, run the following command to start analyzing data:
# Style (default): light mode
shallow-explore -csv ~/complete/path/to/file/sample.csv

# Style: dark mode
shallow-explore -csv ~/complete/path/to/file/sample.csv -style dark

# Style: light mode
shallow-explore -csv ~/complete/path/to/file/sample.csv -style light
Note: The complete path of the file is required to load the data into the program.
Generate a comprehensive summary of your CSV file with statistics about each column:
shallow-explore -csv ~/path/to/file/sample.csv -summaryFilter data based on column values:
# Filter rows where the "Age" column equals "30"
shallow-explore -csv ~/path/to/file/sample.csv -filter true -column "Age" -condition equals -value "30"

# Available conditions: equals, contains, greater_than, less_than, starts_with, ends_with
shallow-explore -csv ~/path/to/file/sample.csv -filter true -column "Name" -condition contains -value "Smith"
Export your CSV data to JSON format:
shallow-explore -csv ~/path/to/file/sample.csv -export-json -export-path "output.json"

# The export-path is optional. If not provided, a timestamped filename will be generated
shallow-explore -csv ~/path/to/file/sample.csv -export-jsonCalculate the correlation between two numeric columns:
shallow-explore -csv ~/path/to/file/sample.csv -correlate -col1 "Height" -col2 "Weight"Detect anomalies in numeric columns using Z-score method:
# Default threshold is 3.0
shallow-explore -csv ~/path/to/file/sample.csv -anomalies

# Custom threshold
shallow-explore -csv ~/path/to/file/sample.csv -anomalies -threshold 2.5shallow-explore supports three types of data: integers, floats, and strings.
The following output is an example of an integer or float column. The column name at the top of the frame followed by a summary line graph of the items, and some quick statistics about the data.

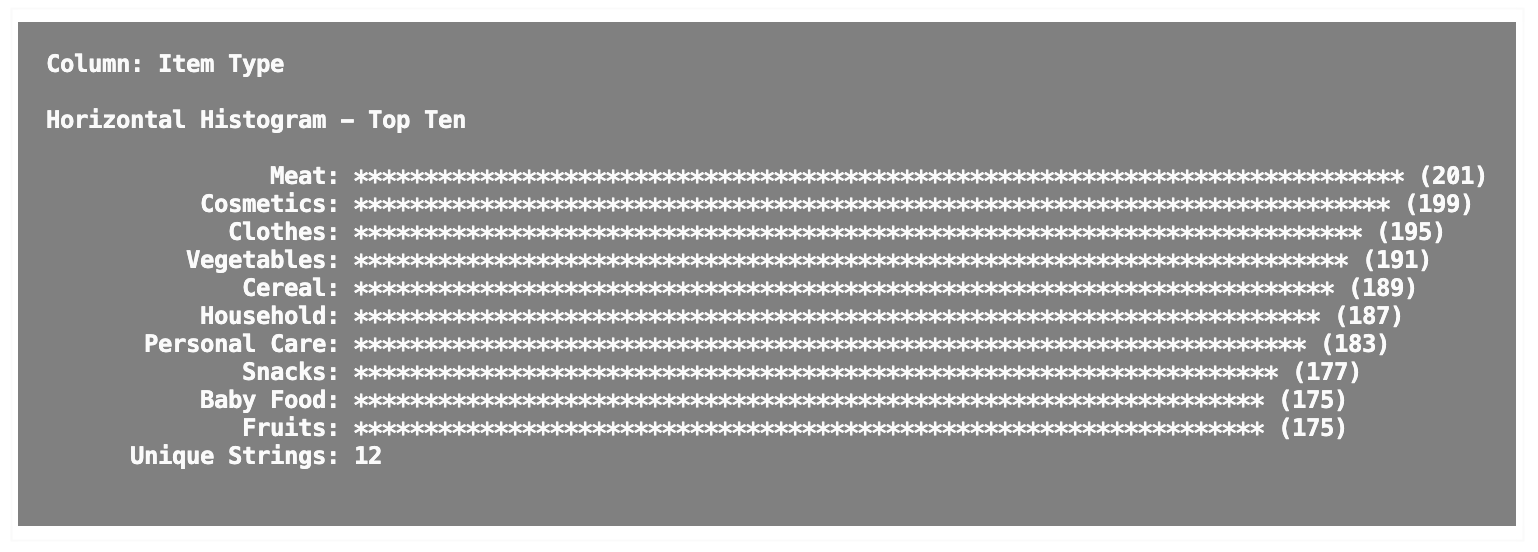
For string-based data, the column name is still at the top of the output. Below the column name lives a horizontal histogram and a count of unique entities found in the column.
If Golang is installed, run the following command:
go install github.com/tmickleydoyle/shallow-explorebrew install goI find myself running and rerunning the same basic statistical analysis on data to get an understanding of how trends are moving. I figured why not make it easier and share it with everyone else! I hope this speeds up your decision making ❤️
- CSV Data Exploration: Visualize and analyze CSV data with automatic recognition of data types
- Data Summary: Get a comprehensive overview of your CSV data with column types and completeness percentages
- Data Filtering: Filter CSV data based on various conditions to focus on specific subsets
- JSON Export: Export your CSV data to JSON format for use in other applications
- Data Correlation: Calculate Pearson correlation coefficients between numeric columns
- Anomaly Detection: Find outliers in numeric data using Z-score method
- Customizable Display: Choose between light and dark mode for better visibility