Skip to content

feat: add VPS resource health insights#1688

Closed
Michaelyklam wants to merge 2 commits into
nesquena:masterfrom
Michaelyklam:feat/issue-693-vps-health-panel
Closed

feat: add VPS resource health insights#1688
Michaelyklam wants to merge 2 commits into
nesquena:masterfrom
Michaelyklam:feat/issue-693-vps-health-panel

Conversation

@Michaelyklam
Copy link
Copy Markdown
Contributor

@Michaelyklam Michaelyklam commented May 5, 2026

Thinking Path

  • Issue Feature request: Live VPS health panel (CPU / RAM / Disk) #693 asks for host resource usage, separate from the already-shipped Hermes agent heartbeat and deep process health probes.
  • The backend/API safety shape is still the right MVP: authenticated coarse CPU, RAM, and disk metrics with no process argv, env, path, or secret exposure.
  • Reviewer feedback made the always-visible top-of-chat bar the wrong placement: useful diagnostics, but too power-user for permanent global chrome.
  • Michael suggested Insights as the better home for current and eventual historical resource consumption, so this follow-up keeps the current metrics and moves the surface under Insights.
  • Historical resource charts need a storage/aggregation contract, so this PR stays narrowly scoped to a live current snapshot in the Insights area.

What Changed

  • Added api/system_health.py, a dependency-free Linux/stdlib metrics collector for aggregate CPU, memory, and root disk usage.
  • Added authenticated GET /api/system/health routing that returns only sanitized aggregate fields plus safe status/error codes.
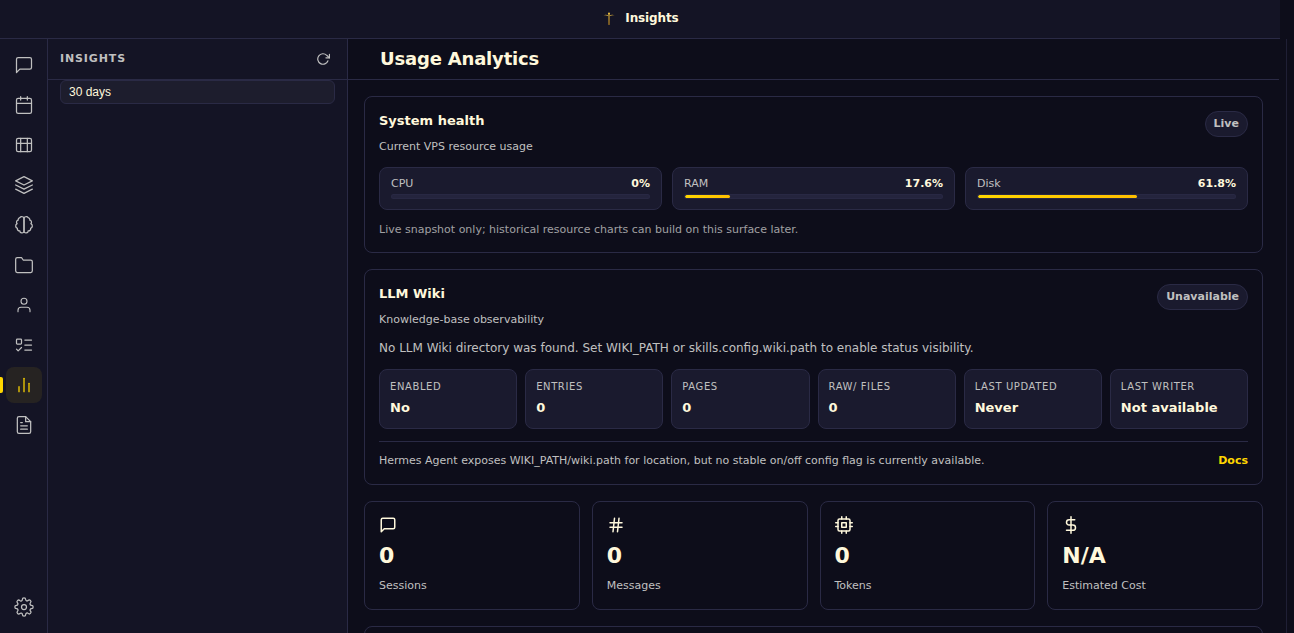
  • Moved the health UI out of the always-visible top chrome and into the Insights page as a compact System health diagnostics/resource card.
  • Kept frontend polling/rendering hooks, but now they only run when the Insights panel is visible and stop when users leave it or hide the tab.
  • Added/updated regression coverage for endpoint registration/auth assumptions, payload normalization, safe error handling, Insights placement, absence from top chrome, frontend hooks, labels, and no private process/env/path data sources.

Why It Matters

Self-hosted Hermes users can still inspect basic VPS pressure from the WebUI without SSH, but the diagnostics no longer consume permanent space in every chat. Keeping it inside Insights matches the existing analytics/observability mental model and leaves room for future historical resource charts without overloading the main conversation surface.

Verification

  • /home/michael/.hermes/hermes-agent/venv/bin/python -m pytest tests/test_issue693_system_health_panel.py -q7 passed
  • node --check static/ui.js → passed
  • node --check static/panels.js → passed
  • /home/michael/.hermes/hermes-agent/venv/bin/python -m pytest tests/test_issue693_system_health_panel.py tests/test_insights.py tests/test_issue1257_llm_wiki_status.py -q15 passed
  • git diff --check → passed
  • env -u HERMES_CONFIG_PATH -u HERMES_WEBUI_HOST /home/michael/.hermes/hermes-agent/venv/bin/python -m pytest tests/ -q4484 passed, 2 skipped, 3 xpassed, 1 warning, 8 subtests passed
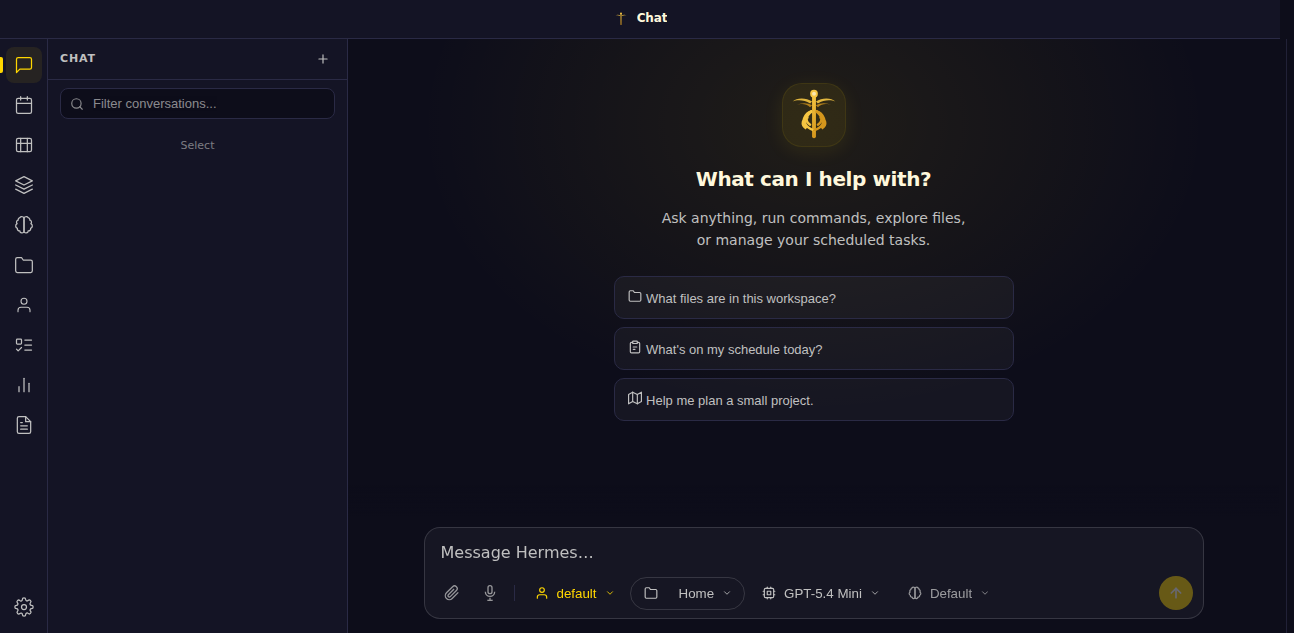
  • Browser validation on an isolated temp WebUI (127.0.0.1:18788): Insights shows the live System health resource card; Chat no longer has a persistent CPU/RAM/Disk health bar in the top chrome.

UI media:

System health card under Insights

Chat view without persistent health bar

Risks / Follow-ups

  • CPU sampling uses a short /proc/stat delta sample, so /api/system/health takes roughly 50ms on Linux; that keeps the first poll state-free and dependency-free.
  • Non-Linux hosts may return partial/unavailable metrics; the Insights card hides itself instead of showing a noisy error.
  • Historical resource charts are intentionally left as a follow-up until the project chooses a persistence/aggregation contract for host metrics.

Closes #693

Model Used

AI assisted.

  • Provider: OpenAI Codex
  • Model: gpt-5.5
  • Notable tool use: Hermes Kanban, terminal/git/gh, pytest, Node syntax checks, isolated WebUI browser QA, screenshot capture

@nesquena-hermes
Copy link
Copy Markdown
Collaborator

Review

Reading the diff at f4b618d against origin/master, the implementation is actually quite clean — coarse aggregate metrics, dependency-free, no process/path/argv leakage, dedicated module mirror of api/agent_health.py. But there are two issues that need addressing before merge.

🔴 Blocker: syntax error in the regression test file

tests/test_issue693_system_health_panel.py:16 has a literal *** in place of a Path expression:

ROUTES_PY = (REPO_ROOT / "api" / "routes.py").read_text(encoding="utf-8")
AUTH_PY=*** / "api" / "auth.py").read_text(encoding="utf-8")

That looks like an editor/tool artefact from a redacted diff — the test file simply will not parse. python3 -m py_compile errors at line 16. The intent is clearly:

AUTH_PY = (REPO_ROOT / "api" / "auth.py").read_text(encoding="utf-8")

…which is then asserted against at line 107 (assert '"/api/system/health"' not in AUTH_PY, "system metrics must not be public"). Please fix this single line — without it the entire test module fails to import and the suite errors out.

🟡 Authentication

The endpoint goes through check_auth in server.py:130 (do_GET calls check_auth(self, parsed) before handle_get), and /api/system/health is not in api/auth.py:21-25's PUBLIC_PATHS allowlist. So when WebUI auth is enabled (single-user password is configured), the endpoint is correctly gated. ✅ The test at line 107 asserts the endpoint name is not in auth.py — that's a fine canary, just note it doesn't actually verify cookie verification in the flow (only that nobody added the path to the public list). Worth a follow-up integration test that hits /api/system/health with is_auth_enabled=True and no cookie, expects 401. Not a blocker.

What concerns me more is the default-no-auth case: a fresh WebUI install with no password set has is_auth_enabled() == False (see api/auth.py:142-...), so /api/system/health returns CPU/RAM/disk percentages on every poll to anyone who can reach the bind address. The default bind is 127.0.0.1 so this is mostly defence-in-depth, but if anyone runs WebUI on a multi-user box or behind a misconfigured reverse proxy, the panel becomes a passive sidechannel. Two possible mitigations, both small:

  1. Gate the endpoint behind is_auth_enabled() even on the public-allow path — return 404 if auth is off (so the feature only lights up for password-protected installs). The frontend would see unavailable and hide the panel via the .system-health-panel.unavailable{display:none} rule already in static/style.css:295.
  2. Or rate-limit it — 5s polling × N tabs per session is fine, but there's no throttle.

Note: the polled /api/health/agent (api/routes.py:2491) and /api/dashboard/status (:2500) sit alongside this endpoint with the same auth posture, so this isn't a new precedent — just calling it out because it's the right time to think about it.

🟢 Implementation looks good

api/system_health.py reads only /proc/stat and /proc/meminfo and uses shutil.disk_usage("/") — no command exec, no argv, no env. The CPU sampler:

def _cpu_percent() -> float:
    start = _read_proc_stat_cpu()
    time.sleep(_CPU_SAMPLE_SECONDS)  # 0.05s
    end = _read_proc_stat_cpu()
    return _cpu_delta_percent(start, end)

50ms blocking sleep on every poll is fine in practice (BaseHTTPServer is threaded), but worth noting this will serialize behind the GIL alongside other GETs. At 5s polling per client × small instance, totally negligible.

_safe_error() strips exception messages to just the type name — good defence against /proc paths leaking when /proc/stat is unreadable on a hardened container. ✅

The frontend at static/ui.js:3068-3155 has the right shape: visibilityState gating to stop polling on hidden tabs, hard .unavailable class on macOS/Windows/non-Linux hosts where /proc/stat raises, single 5s setInterval, and the panel is already wired into index.html:79-100 above the layout. Mobile @media rules at style.css:1295-1299 collapse the bar to a column — looks reasonable.

One small nit: _systemHealthTimer is started both inline and on DOMContentLoaded — the if(_systemHealthTimer) return; guard in startSystemHealthMonitor() makes that idempotent, but the visibility listener is added via addEventListener without a removal path. Not a leak (singleton document), just inelegant.

Action items

  1. Fix the syntax error at tests/test_issue693_system_health_panel.py:16 — this is the only blocker.
  2. (Recommended) Add an early-return when is_auth_enabled() is False, or document that the panel exposes coarse host metrics on no-auth installs.
  3. (Optional) Follow-up integration test that hits /api/system/health with auth-on/no-cookie → 401.

Once the test file parses I'd be happy with this. Closes #693 — the feature itself is well-scoped and matches the feature request shape.

@Michaelyklam
Copy link
Copy Markdown
Contributor Author

Follow-up on the reported test-file syntax blocker:

  • Checked current PR head f4b618d1f6a4a0b3a5133eb6ed31db92f1828a12; tests/test_issue693_system_health_panel.py already has the intended AUTH_PY = (REPO_ROOT / "api" / "auth.py").read_text(...) line, so I did not push an empty/no-op commit.
  • Verification on a fresh disposable worktree:
    • /home/michael/.hermes/hermes-agent/venv/bin/python -m py_compile tests/test_issue693_system_health_panel.py
    • /home/michael/.hermes/hermes-agent/venv/bin/python -m pytest tests/test_issue693_system_health_panel.py -q7 passed
    • git diff --check
    • gh pr checks 1688 --repo nesquena/hermes-webui --watch --interval 10 → Python 3.11/3.12/3.13 checks passing
  • Cleanup: disposable worktree removed.

I left the separate default-no-auth /api/system/health product/security question unchanged, per the current scoped blocker.

@nesquena-hermes
Copy link
Copy Markdown
Collaborator

Correction on the "blocker"

I owe you a correction: the syntax-error claim in my earlier review was wrong, and your follow-up was right.

I re-read the actual file bytes at the PR head (f4b618d):

$ awk 'NR==16' tests/test_issue693_system_health_panel.py | xxd | head -3
00000000: 4155 5448 5f50 5920 3d20 2852 4550 4f5f  AUTH_PY = (REPO_
00000010: 524f 4f54 202f 2022 6170 6922 202f 2022  ROOT / "api" / "
00000020: 6175 7468 2e70 7922 292e 7265 6164 5f74  auth.py").read_t

Line 16 is AUTH_PY = (REPO_ROOT / "api" / "auth.py").read_text(encoding="utf-8"), which is valid. python3 -c "import ast; ast.parse(open(...).read())" returns PARSE OK, and CI is green on 3.11/3.12/3.13.

What happened is the gh pr diff output going through my pipeline rendered the parenthesized expression as ***, and I treated that artifact as the actual file contents instead of re-checking the bytes. The file on disk was always fine. Sorry about the wasted cycle.

Net status on the PR

Blocker retracted. Implementation review still stands:

  • api/system_health.py — clean, dependency-free, /proc/stat + /proc/meminfo + shutil.disk_usage("/"), _safe_error() strips exception messages to type names.
  • api/routes.py:2495-2496/api/system/health correctly outside PUBLIC_PATHS (api/auth.py:21-25), so password-protected installs gate it.
  • Frontend at static/ui.js:3068-3155 has visibilityState polling pause and .unavailable hides the panel where /proc reads fail.
  • Test file parses, 7 assertions pass, source-level shape consistent with tests/test_ollama_model_chip_label_regression.py.

The default-no-auth concern (raised in my prior review §🟡) is unchanged and not a blocker — same posture as the existing /api/health/agent and /api/dashboard/status endpoints. Worth a follow-up issue if you want to gate coarse host metrics behind is_auth_enabled() even on the public path, but that's an independent product decision.

This is mergeable from my side. Will let nesquena take the merge call. Closes #693.

@nesquena nesquena added hold ux User experience / visual polish labels May 5, 2026
@nesquena
Copy link
Copy Markdown
Owner

nesquena commented May 5, 2026

I don't think the information is important enough that I'd want to see it always displayed at the top like that, feels too power user. I wouldn't mind there being an area in settings or a new icon that gives you a rundown of overall system and hermes health including these types of stats but I think having them always present at the very top is overkill. Will leave open for discussion for 24 hours. @aronprins Thoughts?

@aronprins
Copy link
Copy Markdown
Contributor

I don't think the information is important enough that I'd want to see it always displayed at the top like that, feels too power user. I wouldn't mind there being an area in settings or a new icon that gives you a rundown of overall system and hermes health including these types of stats but I think having them always present at the very top is overkill. Will leave open for discussion for 24 hours. @aronprins Thoughts?

It seems this introduces a whole new bar which is a hard no.

Regarding your option perhaps something above the cog wheel in the left rail if anything - I wouldnt be a fan of it but trying to keep an open mine here 😜

@nesquena

@Michaelyklam
Copy link
Copy Markdown
Contributor Author

Michaelyklam commented May 5, 2026

I agree, this probably isn't the cleanest implementation. what if it was under insights? that seems like a better place to put charts on current + historical resource consumption.
@aronprins

@Michaelyklam Michaelyklam changed the title feat: add live VPS resource health panel feat: add VPS resource health insights May 5, 2026
@Michaelyklam
Copy link
Copy Markdown
Contributor Author

Moved the VPS/resource health surface out of the always-visible top chrome and into Insights per the placement feedback.

What changed in follow-up commit afec409755988cd217523e4a1153664a62f4cb61:

  • Removed the global top-of-chat health bar markup.
  • Added a compact System health card at the top of the Insights content.
  • Scoped health polling so it only runs while Insights is visible.
  • Updated regression coverage to assert Insights placement and absence from the top shell.
  • Updated the PR body/title and attached fresh UI evidence.

Verification:

  • /home/michael/.hermes/hermes-agent/venv/bin/python -m pytest tests/test_issue693_system_health_panel.py -q7 passed
  • node --check static/ui.js → passed
  • node --check static/panels.js → passed
  • /home/michael/.hermes/hermes-agent/venv/bin/python -m pytest tests/test_issue693_system_health_panel.py tests/test_insights.py tests/test_issue1257_llm_wiki_status.py -q15 passed
  • git diff --check → passed
  • env -u HERMES_CONFIG_PATH -u HERMES_WEBUI_HOST /home/michael/.hermes/hermes-agent/venv/bin/python -m pytest tests/ -q4484 passed, 2 skipped, 3 xpassed, 1 warning, 8 subtests passed
  • GitHub Actions for Python 3.11 / 3.12 / 3.13 are passing on the new head.

UI evidence:

Historical resource charts are intentionally left as a follow-up unless maintainers want this PR to grow a storage/aggregation contract for host metrics.

@nesquena
Copy link
Copy Markdown
Owner

nesquena commented May 5, 2026

Looks much better, thanks! Going to move towards review and merge

@nesquena nesquena removed the hold label May 5, 2026
@nesquena-hermes nesquena-hermes removed the ux User experience / visual polish label May 5, 2026
@aronprins
Copy link
Copy Markdown
Contributor

Fwiw I think this needs more discussion.

@nesquena Im working in a few branches and might have missed it but do we already havr jnsights there?

Or are we adding that just for this?

@nesquena
Copy link
Copy Markdown
Owner

nesquena commented May 5, 2026

Insights tab already made it in to the project - so this just adds a small part into that tab. For now I consider it an alpha. At some point we can review and decide what stays or goes or if we want to do a refresh

@nesquena-hermes
Copy link
Copy Markdown
Collaborator

Closed by the v0.51.5 release in PR #1713 (merged at 0ea3dfb, deployed to production). Thanks!

Live on production: https://github.com/nesquena/hermes-webui/releases/tag/v0.51.5

🚀

githb-ac pushed a commit to githb-ac-org/hermes-webui that referenced this pull request May 5, 2026
4 PRs (1 surface addition, 3 fixes):
- nesquena#1688 VPS resource health Insights panel (@Michaelyklam, closes nesquena#693)
- nesquena#1709 preserve scroll on stream completion (@Michaelyklam, closes nesquena#1690)
- nesquena#1711 hide rename tooltip on folders (@nesquena-hermes, closes nesquena#1710)
- nesquena#1712 guard localStorage.setItem against QuotaExceededError (@24601)

Tests: 4504 → 4527 (+23). Opus: SHIP, 6/6 verification clean.

Held back: nesquena#1686 (Docker enhance) — Opus flagged sibling-repo dep that
breaks standalone clones. Left open for follow-up.

Co-authored-by: Michael Lam <Michaelyklam1@gmail.com>
Co-authored-by: 24601 <noreply@github.com>
Sign up for free to join this conversation on GitHub. Already have an account? Sign in to comment

Labels

None yet

Projects

None yet

Development

Successfully merging this pull request may close these issues.

Feature request: Live VPS health panel (CPU / RAM / Disk)

4 participants